Amazon: The Flywheel That Will Win The AI Race
Equity research report

Amid the AI craze, it is shocking to see perhaps the biggest winner of the AI revolution trading at close to 100% above fair intrinsic value. Amazon is massive in scale and recorded the most revenue out of any company in the world in 2025. However, growth is not about to slow down anytime soon. Each product segment is well-positioned to capitalize on secular tailwinds, and AI and automation will accelerate all. The flywheel, which has run Amazon to this scale at near-zero margins, will soon be able to accelerate the business at substantially more attractive margin profiles.
Company profile
Theme: Flywheel, Direction: Buy
Symbol: AMZN, Exchange: NASDAQ
Sector: Consumer Discretionary, Industry: Internet Retail
Fair intrinsic value: $467.42 (88.8%), as of April 20, 2026
Market capitalization: $2 680 549 million
Pricing data: P/S 3.7x, P/E 34.5x
TYPEFCAPITAL.COM
Consider following me on X and YouTube.
This article is for informational purposes only and does not constitute investment advice or an offer to buy or sell securities.
Approaching a $ trillion in annual revenue, but it’s still early
Amazon’s ability to enter seemingly any vertical is impressive. It is not clear if Amazon will always emerge as a winner in any given vertical, but it is almost certain that everyone else loses. Over the course of Amazon’s history, shareholders have gotten used to Amazon bleeding capital, staying patient, and eventually achieving market dominance in the vertical. Today’s Amazon is a multifaceted powerhouse, the company that generates the most revenue in the world, and a company that is actively competing in the world’s most important race: the AI race.
Despite approaching a trillion dollars in annual revenue, Amazon remains in the early innings of several secular shifts, including AI, e-commerce, and grocery digitization, cloud migration, automation, and robotics. It is hard to imagine a company of this scale continuing to grow in the double digits, but all signs point towards such an outcome.
[…]roughly 80% of global retail sales still happens in physical stores.
[…]85% of global IT spend remains on-premises.
We’re on the verge of launching Amazon Leo, just beginning commercial service with Zoox[…] and still quite early in what we’ll build in robotics.
[…]Across all of this, AI is not a standalone initiative—it’s a multiplier.
Andy Jassy, Chief Executive Officer
Amazon Shareholder Letter 2025
Figure 1: Segmented revenue
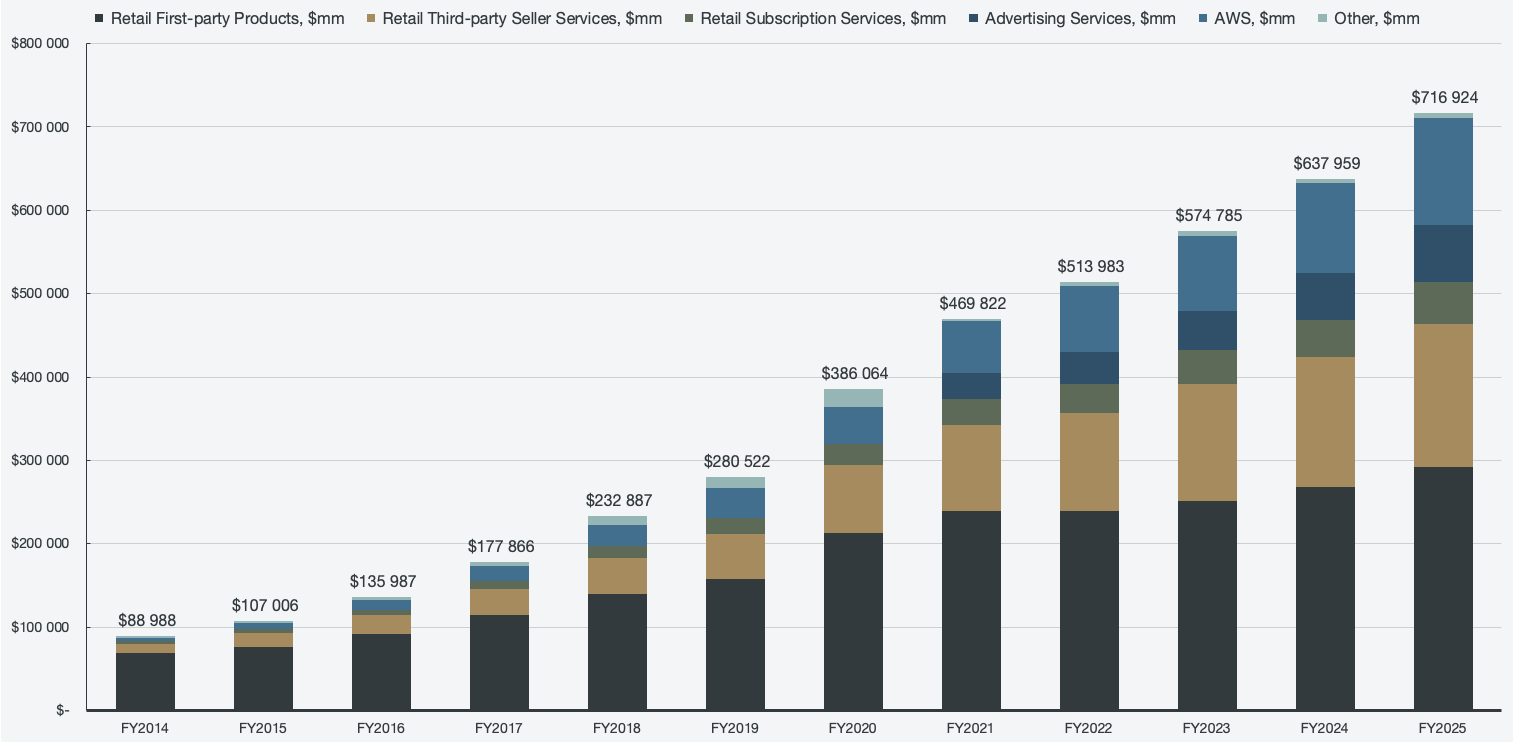
The core to being able to continue compounding growth is to have business segments that complement each other in order to create a robust flywheel effect. Amazon has managed to do that in each of its lines of business, tying the whole business together and empowering each segment into an interconnected ecosystem where the high-margin segments subsidize and empower the low-margin segments.
The original Virtuous Cycle (retail flywheel)
The retail flywheel, as famously sketched by founder Jeff Bezos on a napkin in 2001, is Amazon’s core self-reinforcing growth engine. The focus is on scale, efficiency, and driving customer obsession.
Offering the lowest prices, the broadest selection, and faster delivery leads to a better customer experience.
A good customer experience drives traffic, purchases, and loyalty to the platform.
Third-party sellers are attracted because they want access to the traffic.
More sellers mean a wider selection of products, further elevating the customer experience.
As the cycle spins, Amazon achieves a massive scale, leading to lower economies of scale in logistics and increased purchasing power.
Reinvest the savings into a better customer experience and repeat the cycle.
Low prices and better selection → Increased traffic → More sellers → Expanded selection → Cost-structure loop → Low prices and better selection.
The flywheel is evident when looking at retail sales over a long period of time. The operating margins are seemingly kept low on purpose while compounding scale. The operating margins seem like they are improving as of 2018 and onward, but that is not attributed to the retail sales; it’s attributed to the Amazon ads platform becoming material. While still relatively tiny compared to overall retail revenue, as of 2017, ads contributed more to operating profit than core product sales, according to Amazon. Ads’ operating margins are not broken out, even though revenue now is (as of 2022), but it is likely the reason retail operating margins are growing.
Figure 2: Retail revenue and retail operating margin, the virtuous cycle
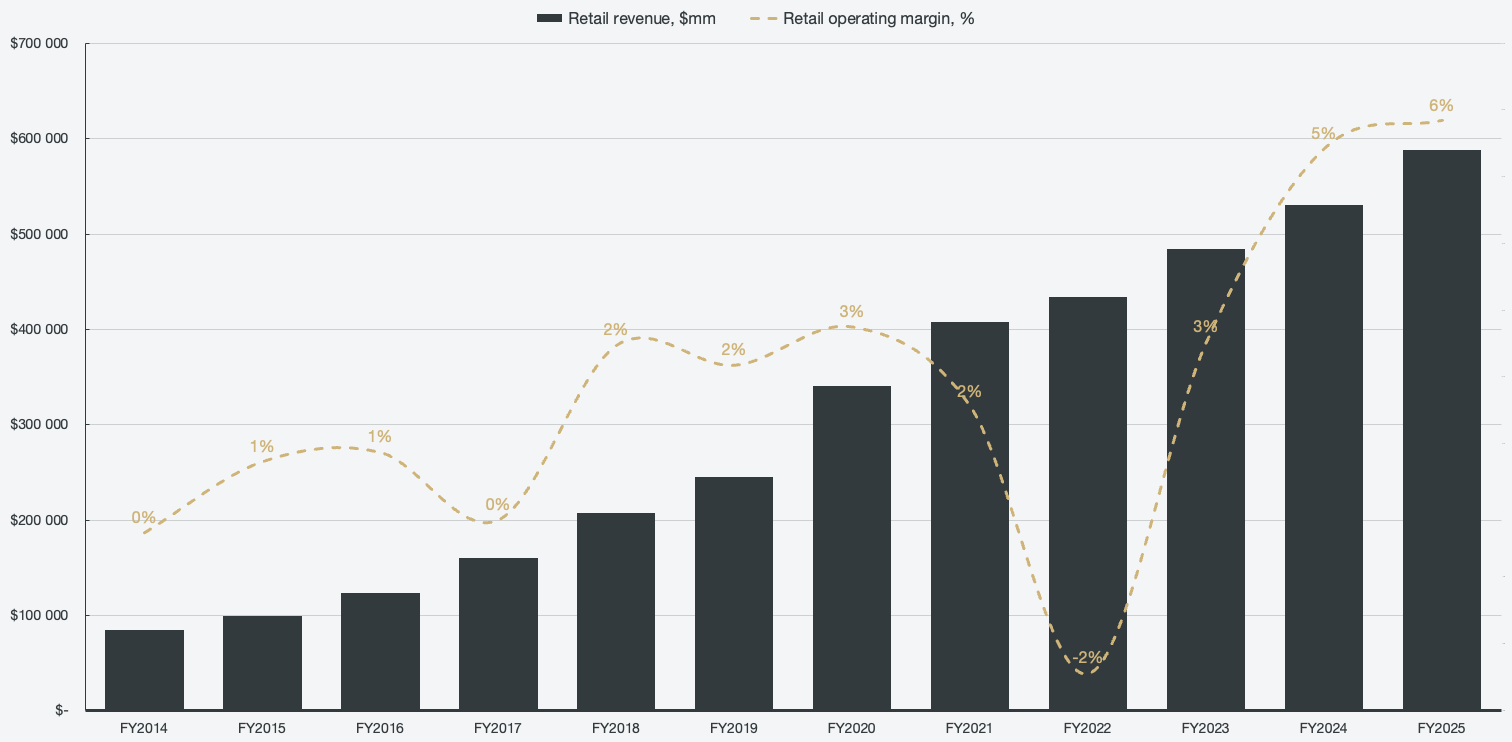
Working the math, I still assume that the retail segment operates on negative margins, and I’ll break it down further in this article. With time, due to the sheer scale, robotics and automation through AI will turn a 30-year flywheel from a structural loss-maker to a mid-single-digit margin business. That may not sound like a lot, but at a run-rate that is approaching $1 trillion, each basis point increase in margin is massive. That is all while keeping the flywheel intact, with continuous scale, and while building out more profitable segments.
The Infrastructure Engine (AI and cloud flywheel)
On the AI end, Amazon’s strategy is a vertically integrated loop where each layer feeds the next, which in turn creates a compounding cost and demand advantage. Much of the attention in AI has been directed towards the labs (Anthropic, OpenAI, etc.), or the pure infrastructure plays (neoclouds, energy companies), but the nearsightedness undermines the advantages that companies such as Amazon and Google have.
Custom silicon (Trainium, Graviton, and Nitro) gives AWS better price-performance than merchant GPUs and CPUs. By changing the economics of AWS, margins are elevated.
Lower inference costs make it more economical to deploy AI more broadly inside Amazon’s services.
Broader AI deployment generates more data, producing training signals that other cloud providers can’t access.
Improved training data improves cash generation, which is then redeployed (dwarfing most competitors’ spending).
Using capital that was generated in the loop, Amazon can build the next generation of silicon and capacity.
Custom silicon → Better price & performance → Improved AI services (Bedrock, SageMaker) → Lower inference costs → AI application build-out → More proprietary data and usage → Cash flow funding capex for reinvestment → Next generation of custom silicon and capacity.
The flywheel is structurally different from most other AI companies, which tend to run a single loop, while Amazon runs all five. While Amazon has its own chips to improve AI economics, competitors have to pay Nvidia margins. While Amazon builds out its own hyperscale cloud, competitors have to rent compute. Amazon generates billions of dollars in cash flow from its AI ventures, while competitors burn venture capital. The massive proprietary data from retail, logistics chains, and Prime lead to more cash generation, while competitors scrape data. Amazon has large amounts of in-house demand that de-risks the infrastructure build, while competitors must find external demand.
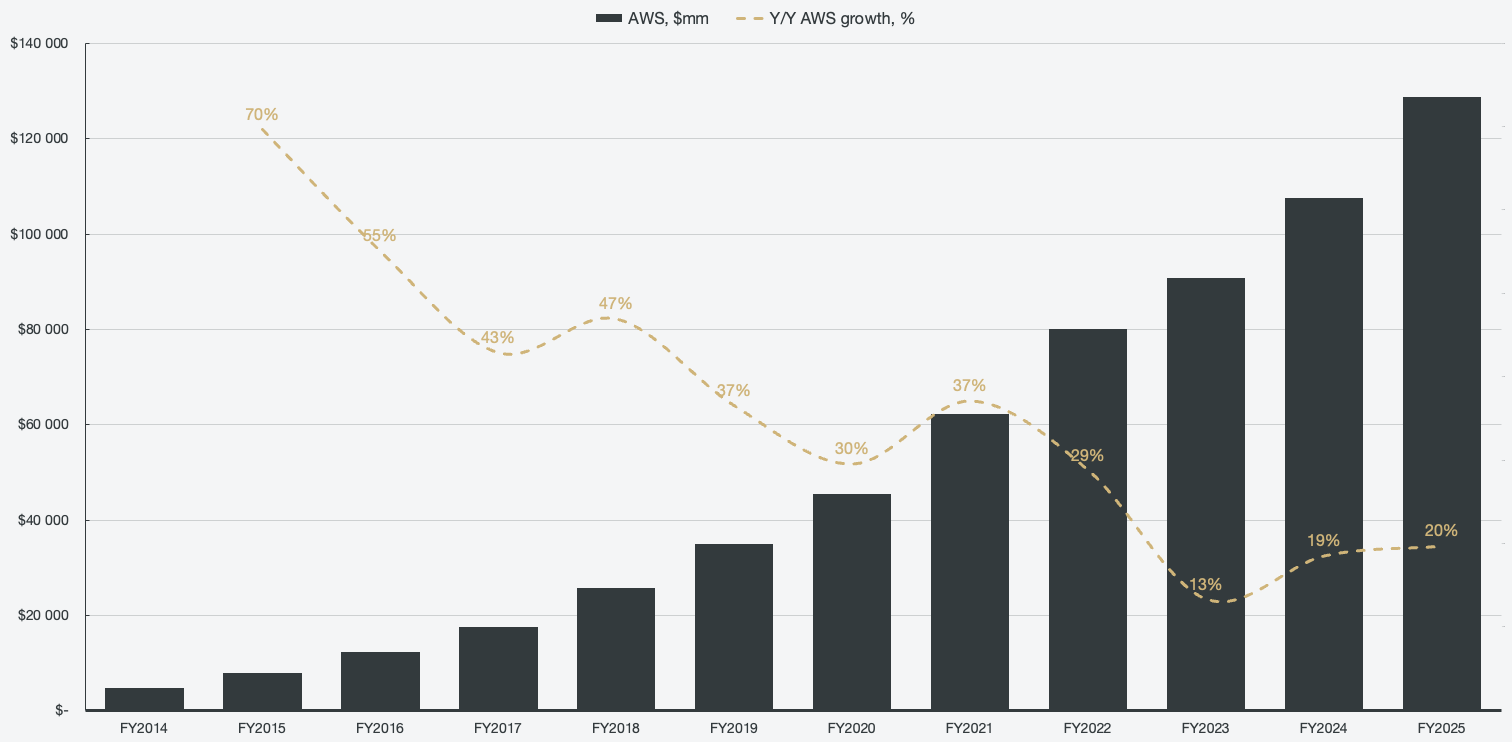
Figure 3: AWS revenue and AWS growth
The Amazon super flywheel
By now, you may have noticed that the retail and AI flywheels share a lot of common characteristics, and that is because they should not be seen as separate systems. Both flywheels share customers, data, and capital, and each feeds into the other at various junctions throughout the flywheel. The retail side of the business generates signals (data) and demand, while the AI side generates margin and capability, accelerating one another. Amazon is not a pure commerce player or a pure AI player; instead, it manages to leverage both to be a dominant force in any segment.
AWS capital generation funds the whole ecosystem.
Funds next-gen silicon, which lowers AWS costs and expands AWS margins.
Subsidizes the retail flywheel’s lower-price engine.
Retail data trains and grounds the AI
Every Prime subscription, every query, every delivery decision, etc, creates a proprietary data training signal.
This segment actually has its own mini flywheel inside: Better signals → better Rufus, seller agents, ad tools (making retail smarter) → better recommendations, more efficient ads and fulfillment → better experience → better signals.
Advertising serves as a bridge between businesses
Ads sit on top of retail, but have unit economics that even surpass AWS. It’s also powered by both retail intent data and AI optimization. It is perhaps the clearest example of the two flywheels producing something neither flywheel could produce alone. Retail serves the audience, AI provides targeting, and the cash that is generated funds both separate loops.
Prime subscriptions and logistics provide the physical layer
Prime helps provide an identity (shopper, viewer, reader, AI-assistant user), while logistics (robots, delivery networks, infrastructure) is the moat in the physical world. AI alone can’t build either, but can optimize both.
Each piece of the puzzle is important and helps build a robust business that is not replicable. However, each of the flywheels on its own can be matched and replicated.
Walmart can match the retail scale.
Microsoft and Google can match the AI infrastructure.
Meta and Google can match the advertising segment.
FedEx and UPS can match logistics.
However, no competitor can run the synergistic flywheel across all four gears simultaneously, with the same customer base and with the same cash flow outlook. Investors are worried seeing $200 billion in capital expenditures being forecasted by management for 2026, but it is necessary to keep the integrity of the flywheel. If AWS slows down, the retail cross-subsidy would weaken. If retail slows, the AI segment would lose its data and demand edge. The capital expenditures being spent on AI infrastructure are necessary expenses to accelerate the flywheel, to grow scale, and improve unit economics.
Growth ahead
Despite the already massive scale, the growth opportunities for the business are quite vast across each segment.
Retail segment
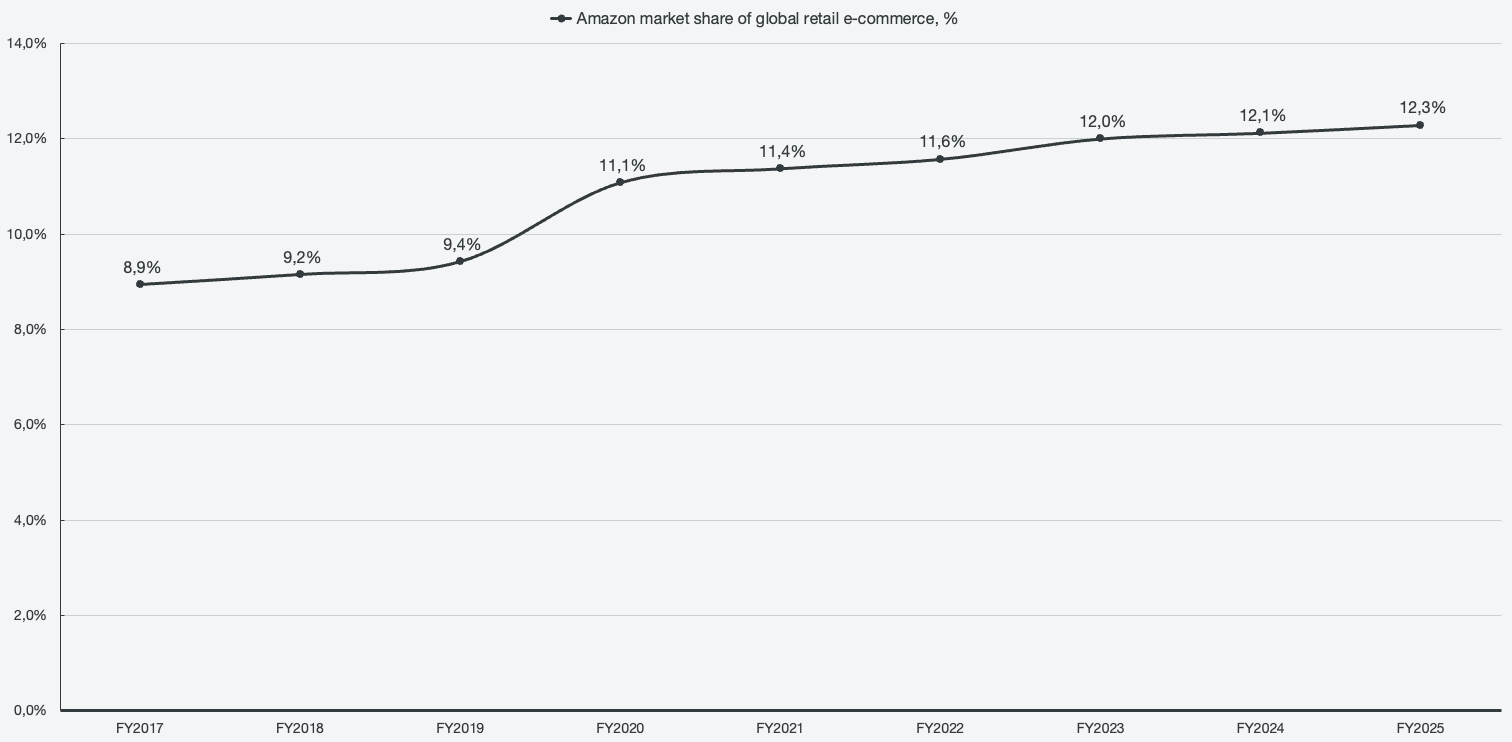
Starting off with retail, as Andy Jassy mentioned, ~80% of commerce is still happening physically. There is a lot of growth ahead as economies move towards e-commerce, and of that pie, Amazon is still relatively tiny despite being the largest e-commerce market globally.
To calculate the market share, we have to first make some assumptions since Amazon does not report its gross merchandise value (GMV). Its first-party sales translate directly to GMV as Amazon owns the inventory and records the full transaction as revenue, but the third-party revenue is subject to a take rate, which is where we have to make assumptions in order to back out the GMV. The third-party seller services line item is revenue that Amazon collects on third-party sales, not GMV itself. I bundle referral fees, FBA fulfillment fees, FBA storage fees, and other miscellaneous line items such as ad placement.
To do so, first, we need to grab the third-party unit share, which is 62% for FY2025.
However, that calculation assumes that first-party and third-party sales have identical average unit prices, which is unlikely. Third-party selling prices are likely ~30-35% higher than first-party prices since first-party skews toward low average selling price household essentials (i.e., Amazon Basic), while third-party skews toward branded items and higher ASP goods. If we factor that in, the calculation changes (using 32% premium factor):
This roughly translates to a 30% take rate. Peeking over at guesses from industry analysts, Amazon’s third-party take rates are in the estimated ranges of 27-31% (lower results in higher GMV). That gives us a total of $843.2 in GMV for FY2025, and I use the assumption of 30% take rate for historical periods as well. Now that we can estimate Amazon’s GMV, we can measure it against the global e-commerce market and get a market share estimate.
Figure 4: Amazon’s global e-commerce market share