

Brookfield Asset Management: A Compounders Dream
Initiating equity research coverage

It is rare to come across a business that is of such high quality, consistent, and predictable that it compounds the investors' capital without much of a worry on a year-to-year basis. This Warren Buffett quote comes to mind when thinking about how Brookfield Asset Management operates:
Only buy something that you'd be perfectly happy to hold if the market shut down for 10 years.
The quote emphasizes owning a business of high quality, strong cash generation, and sustainability. How fitting that Brookfield Asset Management is helmed by what many refer to as “Canada’s Warren Buffett”: Bruce Flatt.
Company profile
24 August, 2025 Initiated coverage
Direction: Buy
Previous fair intrinsic value: N/A, as of N/A
Symbol: BAM, Exchange: NYSE, TSX
Sector: Financials, Industry: Asset Management
Theme: Compounding
Fair intrinsic value: $67.39 (10%), as of August 24, 2025
Market capitalization: $99 424 million
Pricing data: P/S 23x, P/E 41x
TYPEFCAPITAL.COM
Consider following me on X and YouTube.
This article is for informational purposes only and does not constitute investment advice or an offer to buy or sell securities.
Brookfield Asset Management is a complicated business that is fairly simple to understand. They are one of the world’s largest global alternative asset managers and oversee $1.12 trillion in assets under management (AUM), including $563 billion in fee-bearing capital. BAM generates revenues from management and performance fees tied to diversified funds backed by long-term institutional capital as well as retail capital.
BAM operates across five core segments: renewable power and transition, infrastructure, real estate, private equity, and credit. They have a 25-year-long track record of delivering impressive returns by consistently positioning capital well across various high-quality, essential assets in industries with secular growth.
The backbone of modern economies
Over a 25-year period, BAM’s private equity strategy has returned 27% gross IRR, which is the best track record in the entire private equity industry over such a long period of time. Real estate has returned 21% gross IRR, renewable power and infrastructure have returned 15% gross IRR, and the credit strategy has returned 22% gross IRR. In total, over $225 billion of profits have been generated for investors over the past 30 years.
The overview of what BAM does can be explained in four simple steps:
Pick good sectors.
BAM adapts to industries with secular tailwinds.
As an example, railroads, hydro, and pipelines in the past are exchanged for data centers, energy (solar, batteries, and nuclear), and logistics.
Raise capital.
BAM has longstanding partnerships with the largest and most sophisticated institutional investors.
BAM’s reach is global and diversified.
Invest.
Identify investments with secular tailwinds.
Assess opportunities to build or buy.
Leverage the Brookfield Ecosystem.
Scale through organic or inorganic growth.
Operate well.
BAM’s owner-operator mindset enables a partnership approach that aligns interests and goals with clients.
Figure 1: Brookfield Asset Management’s self-reinforcing flywheel
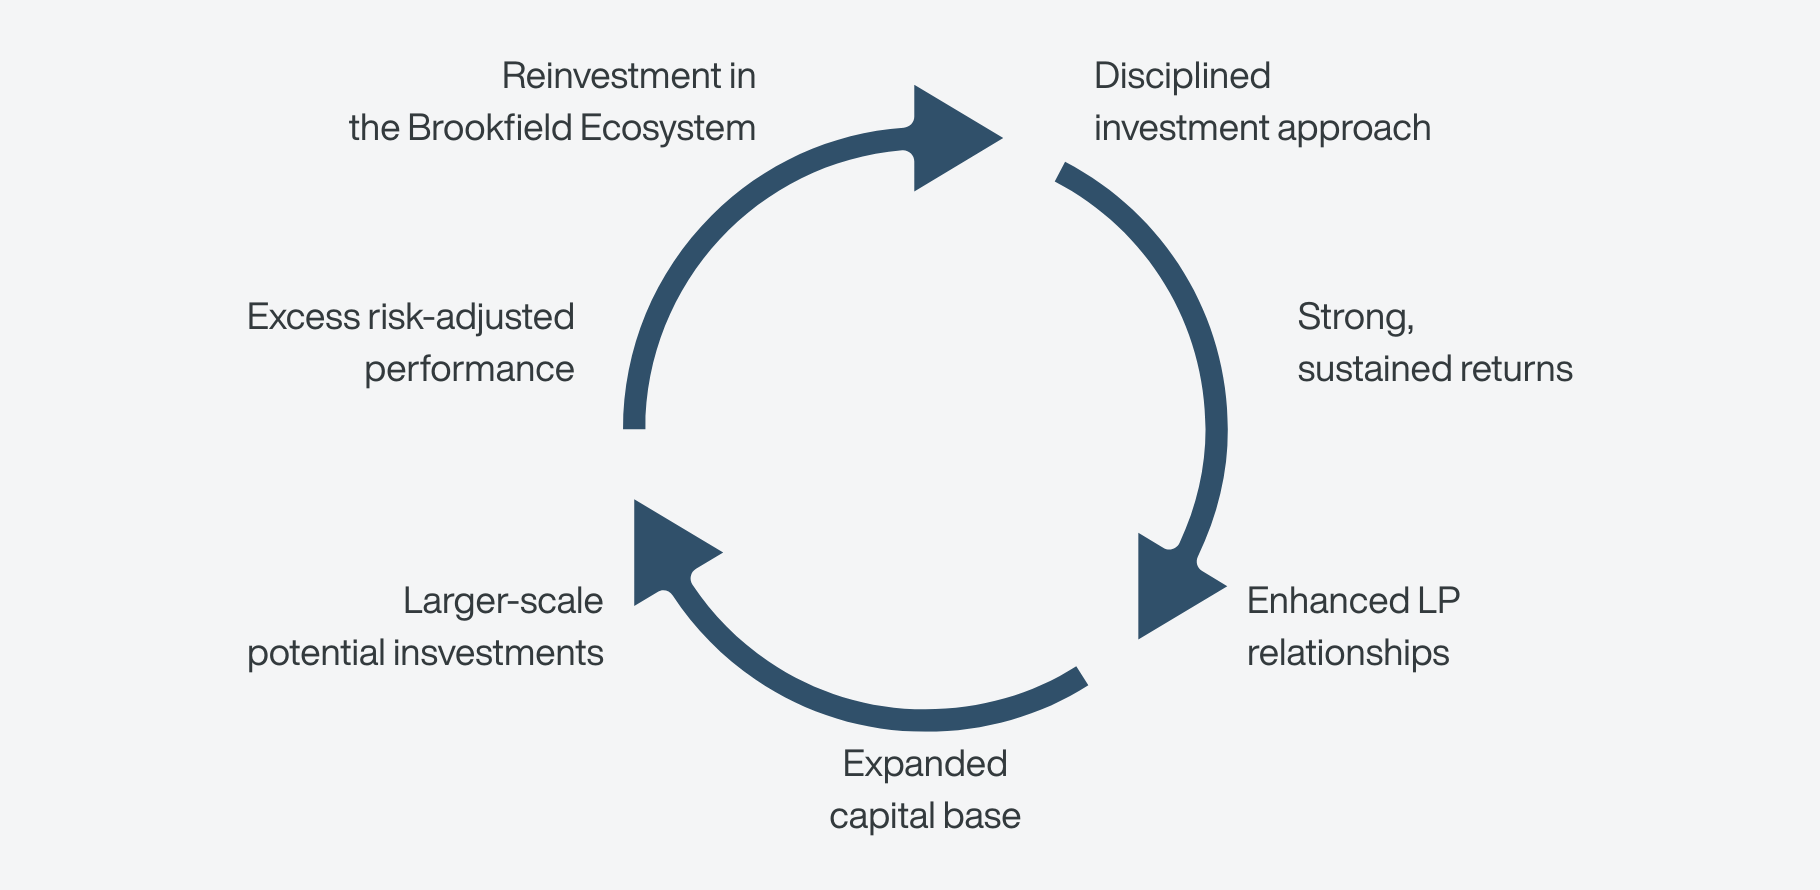
BAM’s business model reinforces itself over time, where each step feeds the next. The result is a cycle of growth with compounding advantages.
Disciplined investment approach
Real assets with an owner-operator mindset that emphasizes operational improvement rather than financial engineering.
Strong, sustained returns
Builds credibility among peers and markets.
Enhanced LP relationships
Delivering strong results deepens relationships with LPs, making them more likely to commit additional capital to Brookfield.
Expanded capital base
Strong LP relationships allow Brookfield to expand its pool of capital. The resulting fee-bearing capital drives Brookfield’s recurring fee revenues.
Larger-scale potential investments
More capital means that Brookfield can pursue large and complex deals, such as large-scale infrastructure or renewable projects. Smaller competitors can’t easily access deals of this scale.
Excess risk-adjusted performance
Scale and expertise allow Brookfield to generate strong returns relative to benchmarks, reinforcing Brookfield's reputation as a leading alternative asset manager.
Reinvestment in the Brookfield Ecosystem
Resulting profits and expertise gained are reinvested into Brookfield's ecosystem. This fosters expanding teams, platforms, and funds, which strengthens Brookfield’s competitive edge.
The compounding flywheel effect is evident in the long-term goals set by the management team during the investor day presentation in 2024. It took Brookfield Asset Management 25 years to gain $1 trillion in AUM, and they expect the next $1 trillion to occur in less than 5 years. By 2029, the targets are $2 trillion in AUM, $1 trillion in fee-bearing capital, and $5 billion in fee-related earnings. In short, that is doubling every aspect of the business in 5 years, proving the leverage that has been built over a 25-year span.
The management team is exceptionally important in this line of business, and their success is measured in their ability to procure meaningful deals. Brookfield Asset Management strives to be active across industries with secular tailwinds, and one such example is addressing the power, cooling, and computing demand from the surge in AI advancements. Brookfield is positioned as a foundational provider for the AI trend.
Brookfield is the world's largest AI infrastructure investor, with more than US$100 billion deployed across data, power, and compute assets.
Luke Edwards, Brookfield Japan CEO
Hitachi news release
Recent press releases:
Brookfield and Google Sign Hydro Framework Agreement to Deliver up to 3,000 MW of Homegrown Energy in the United States
Brookfield to invest €20 billion in France’s AI Infrastructure
Brookfield To Advance AI Infrastructure in Sweden Through SEK 95 Billion Investment
Robust operations
While BAM has over $1 trillion in current AUM, only the fee-bearing portion is of interest when analyzing BAM. Fee-bearing capital currently sits at a total of $562.74 billion. Not all AUM is fee-bearing, since not all managed assets are structured to generate management fees. For example, certain capital may be uninvested or committed but not yet called. Other examples include publicly traded affiliates, where a portion of capital represented by public market float does not generate fees.
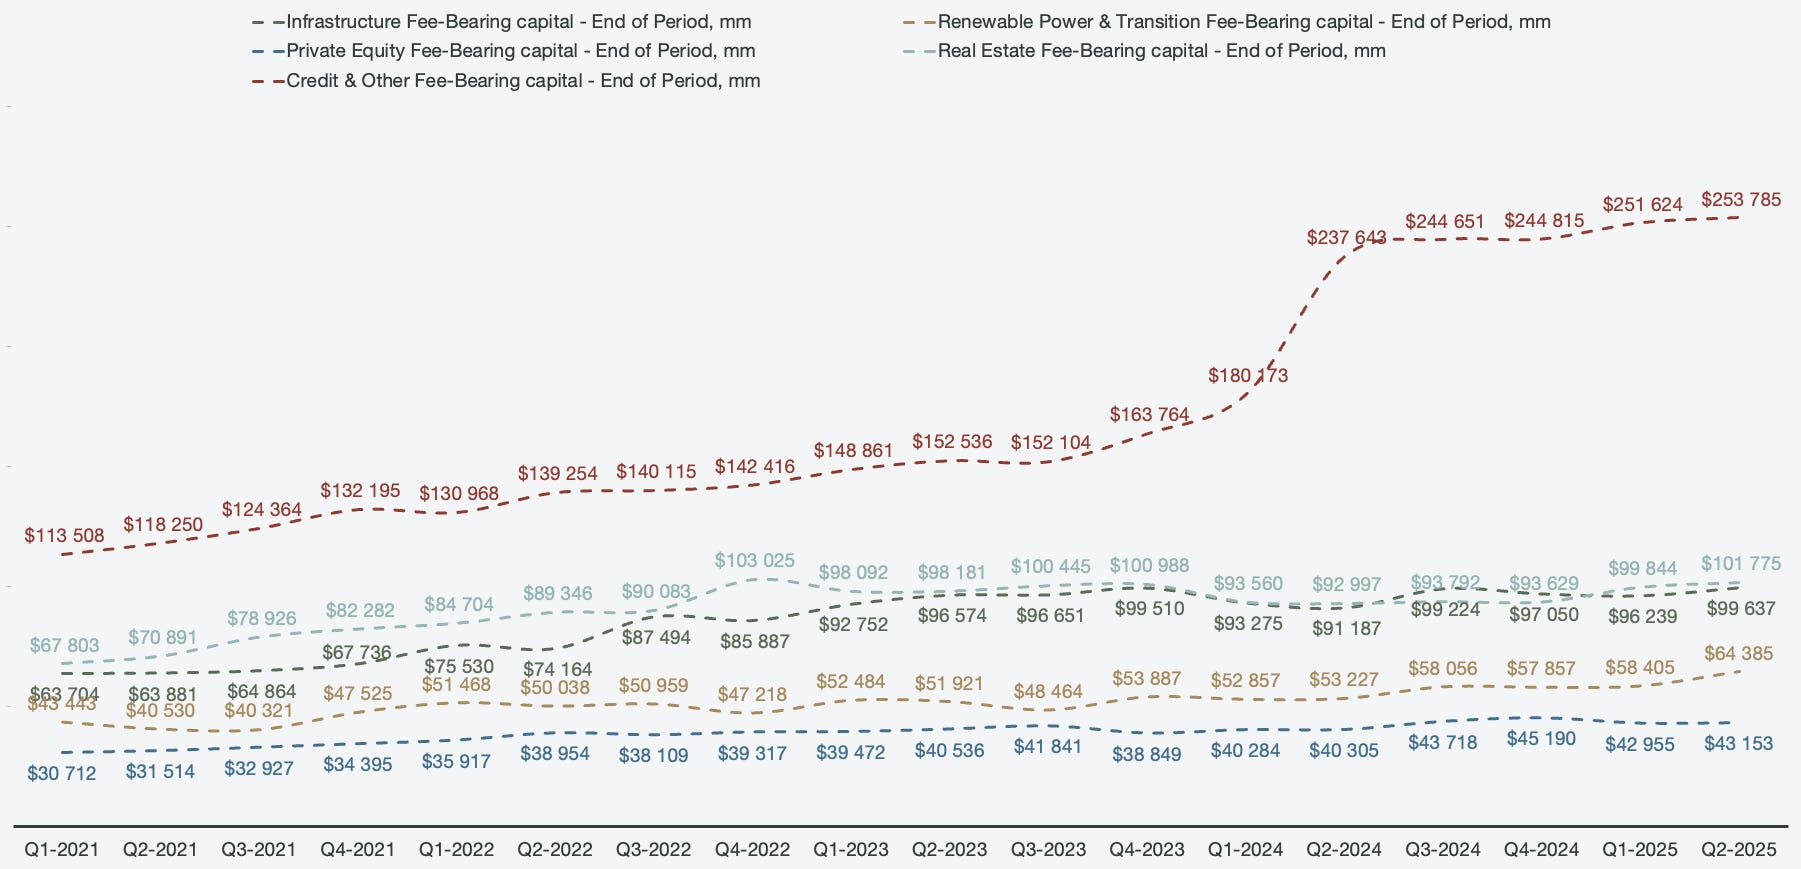
Figure 2: Segmented fee-bearing capital
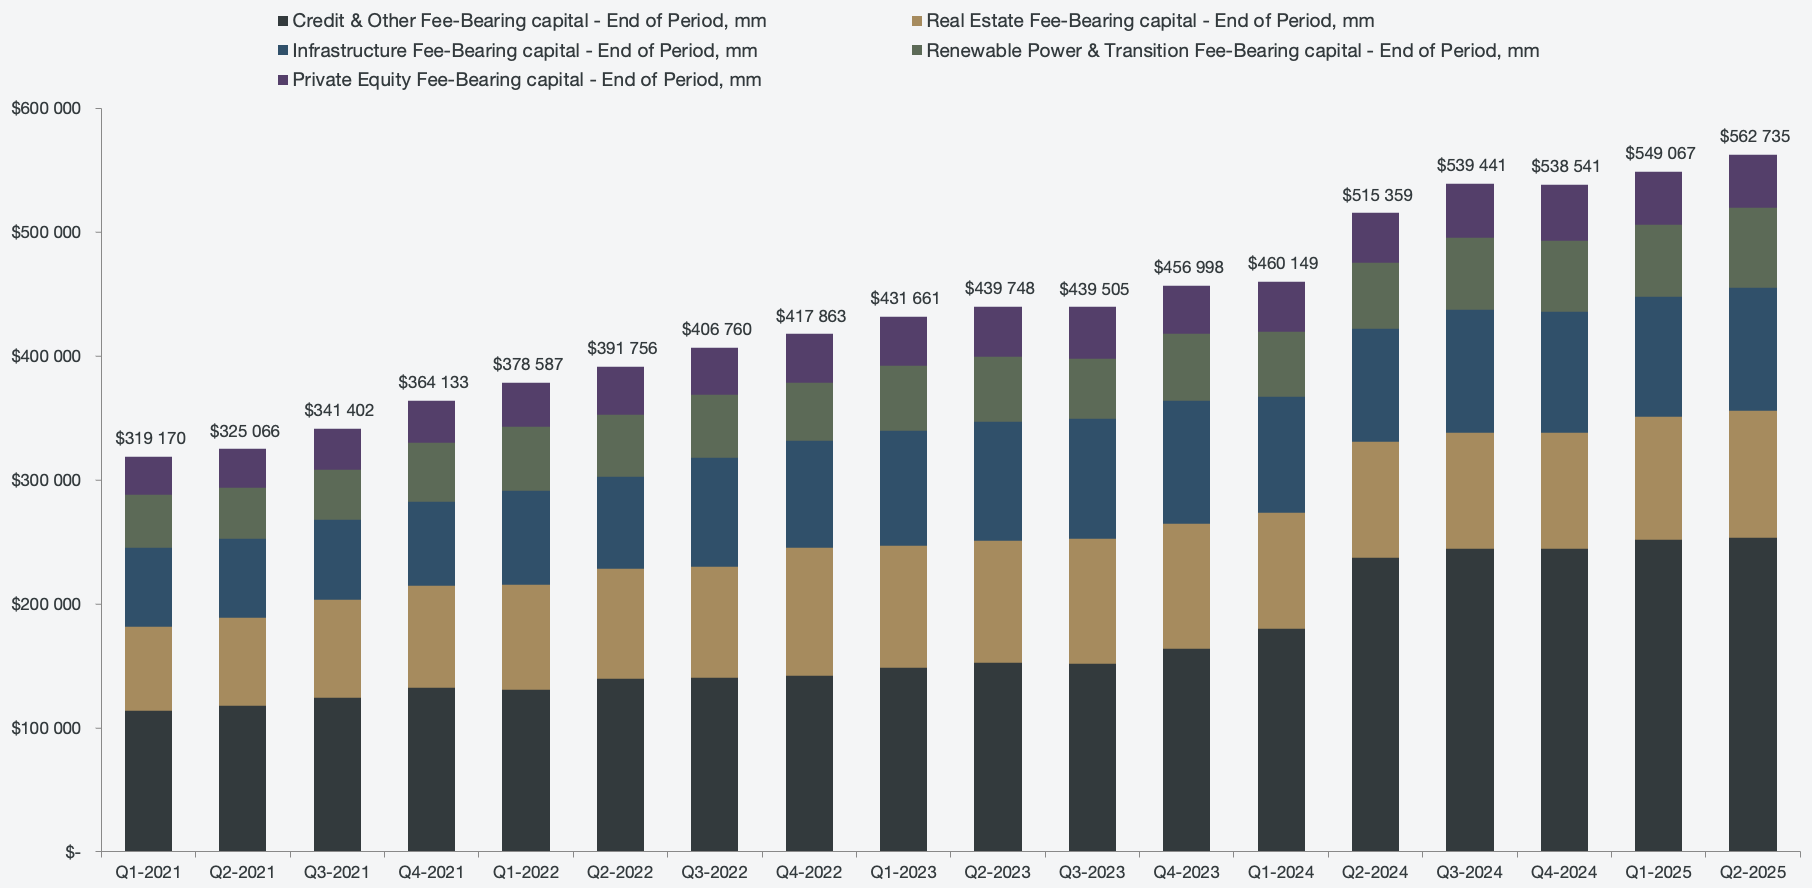
It is important for investors to keep track of the source of the growth in fee-bearing capital. Ideally, there should be positive net flows in order to measure the confidence level in the asset manager. In the charted period, only Q3 of 2023 had a negative net change in total fee-bearing capital. It was not driven by net negative flows, but rather market depreciation. Several of BAM’s investment vehicles are publicly traded subsidiaries, and as such, quarterly performance can have outliers driven by market depreciation. Under no trackable period has there been negative net flows, which shows the credibility of the company in the eyes of investors.
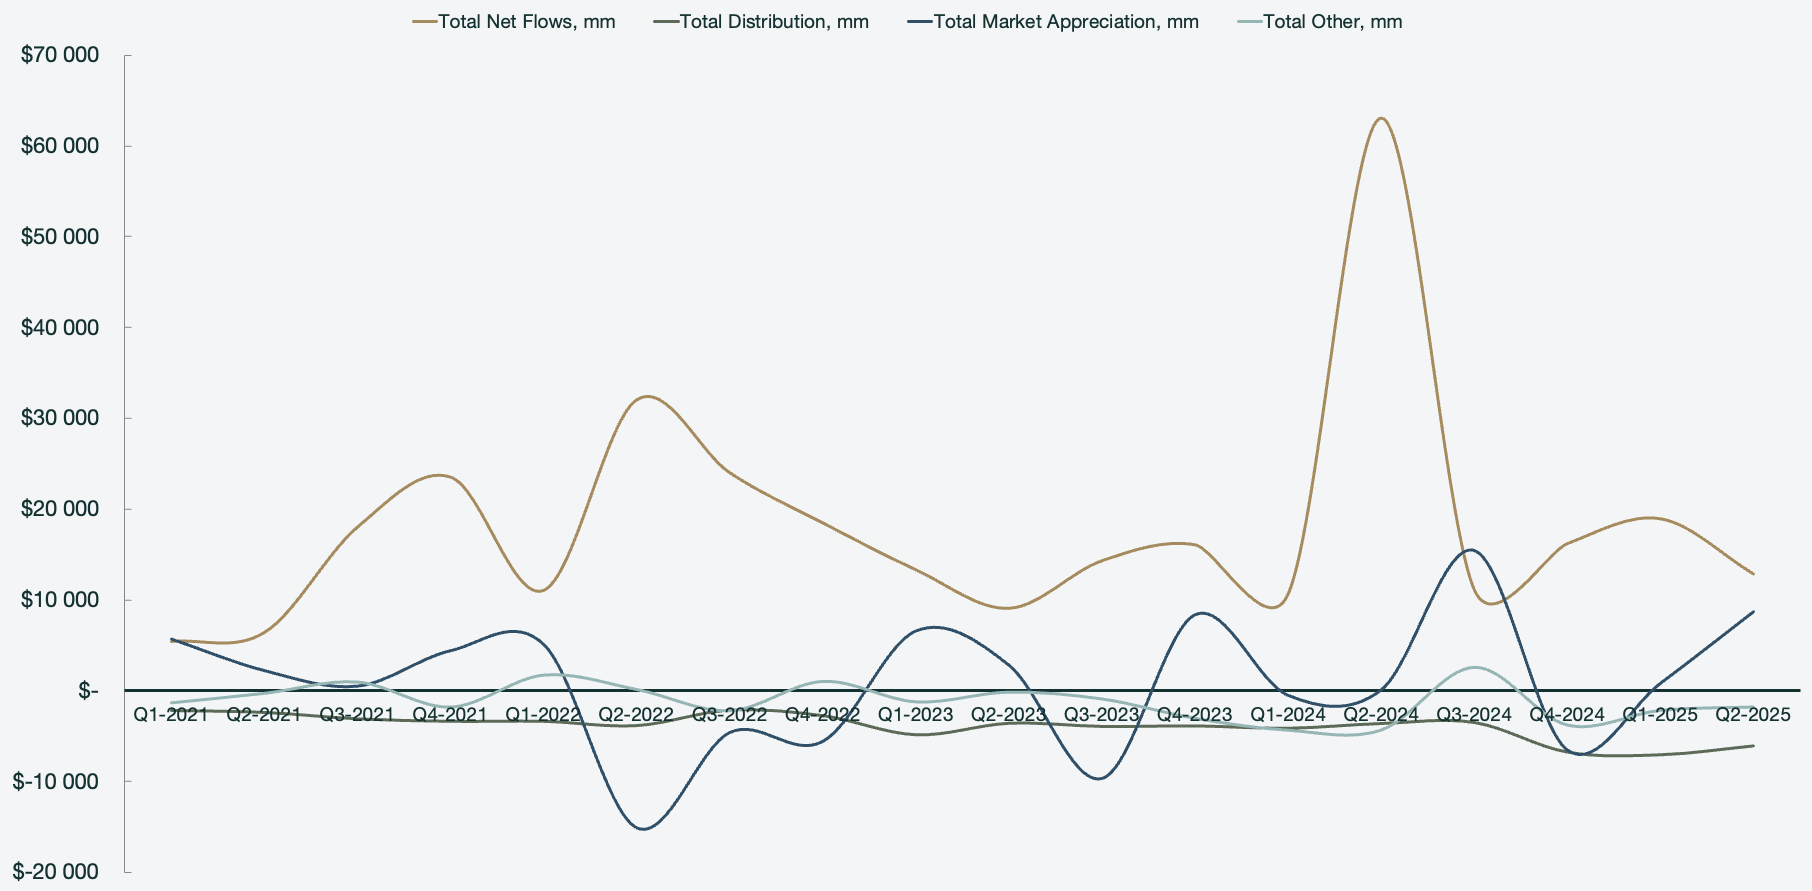
Figure 3: Segmented fee-bearing capital AUM contribution sources
Not all investment strategies feature the same fee revenue yield profiles. However, it is not meaningfully useful to track the fee yield on a segmented basis due to the limited visibility we have as investors in the next investment opportunity for BAM. Instead, I look at consolidated numbers in terms of yield. If the yield decreases meaningfully, it could signal that the margin is being compromised in favor of growing assets. Yield on fee-bearing capital is defined as:
Figure 4: Yield on fee-bearing capital and management expense ratio (MER)
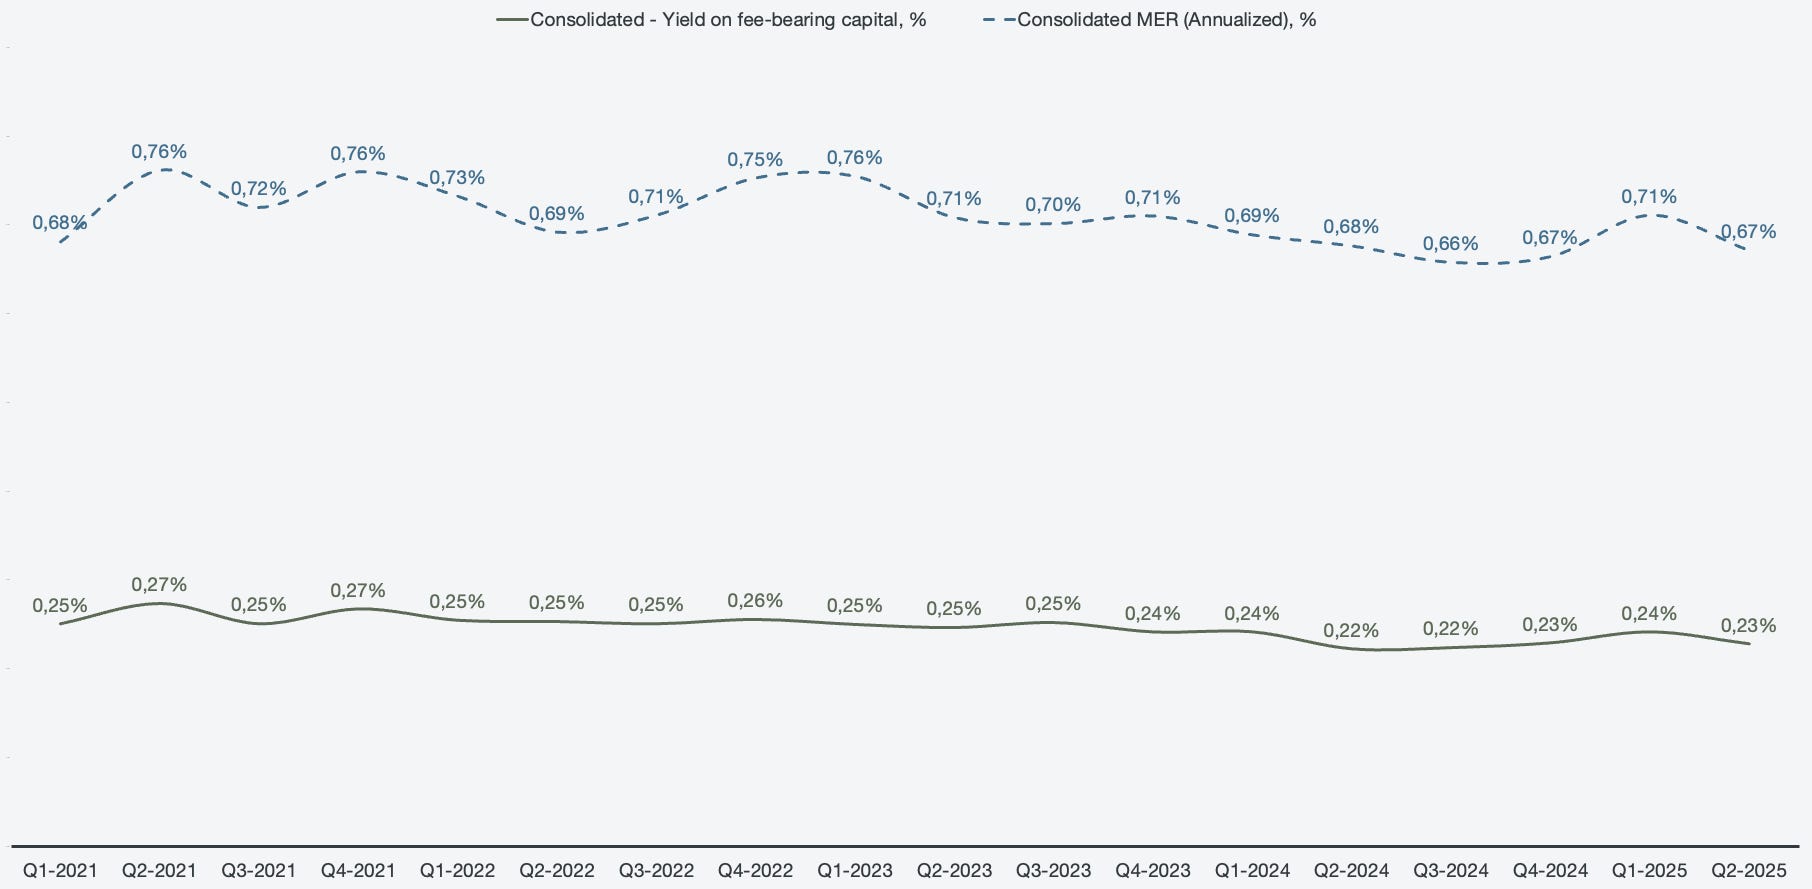
In addition to the fee yield, it is important to keep track of the management expense ratio (MER). Both KPIs experience a meaningful drop as of Q2 2024 and onwards.
The management expense ratio is defined as:
Where F=base management & advisory fees, A=average fee-bearing capital, d=days in period, D=days in year.
We can map out the segmented figures in order to understand the source of the drop in both fee yield and MER. When looking at the segmented fee-bearing capital, there is a very clear increase in the credit strategy occurring simultaneously, as we can observe a drop in yields.
Figure 5: Segmented fee-bearing capital
The explanation in this case would be that the credit strategy features significantly lower yield. This is confirmed when looking at segmented MER and yields.
Figures 6 & 7: Segmented fee-bearing capital yield and annualized MER

