dLocal: Differentiated EM Payments Leader At An Attractive 152% Upside
Equity research report

Finding differentiated businesses in a crowded space is always exciting, and dLocal fits the bill. Similar to my coverage of PayPay and how it has differentiated itself from the rest of the fintech space, dLocal also operates in a market with limited competition and immense upside driven by secular tailwinds.
dLocal operates a payments ecosystem in (primarily) emerging markets where traditional finance networks have low penetration (e.g., card networks such as Visa, Mastercard, etc.). dLocal handles hundreds of alternative payment methods (APMs), currency conversions, compliance infrastructure, fraud prevention, tax integrations, and settlement services. In essence, they eliminate the need for merchants to build local integrations in emerging markets, which are often highly complex and fragmented. The business is inherently sticky, as evidenced by its very impressive customer retention rate.
Company profile
Theme: EM Fintech, Direction: Buy
Symbol: DLO, Exchange: NASDAQ
Sector: Technology, Industry: Software - Infrastructure
Fair intrinsic value: $33.07 (152.02%), as of April 12, 2026
Market capitalization: $3 959 million
Pricing data: P/S 3.6x, P/E 20.1x
TYPEFCAPITAL.COM
Consider following me on X and YouTube.
This article is for informational purposes only and does not constitute investment advice or an offer to buy or sell securities.
One man’s trash is another man’s treasure
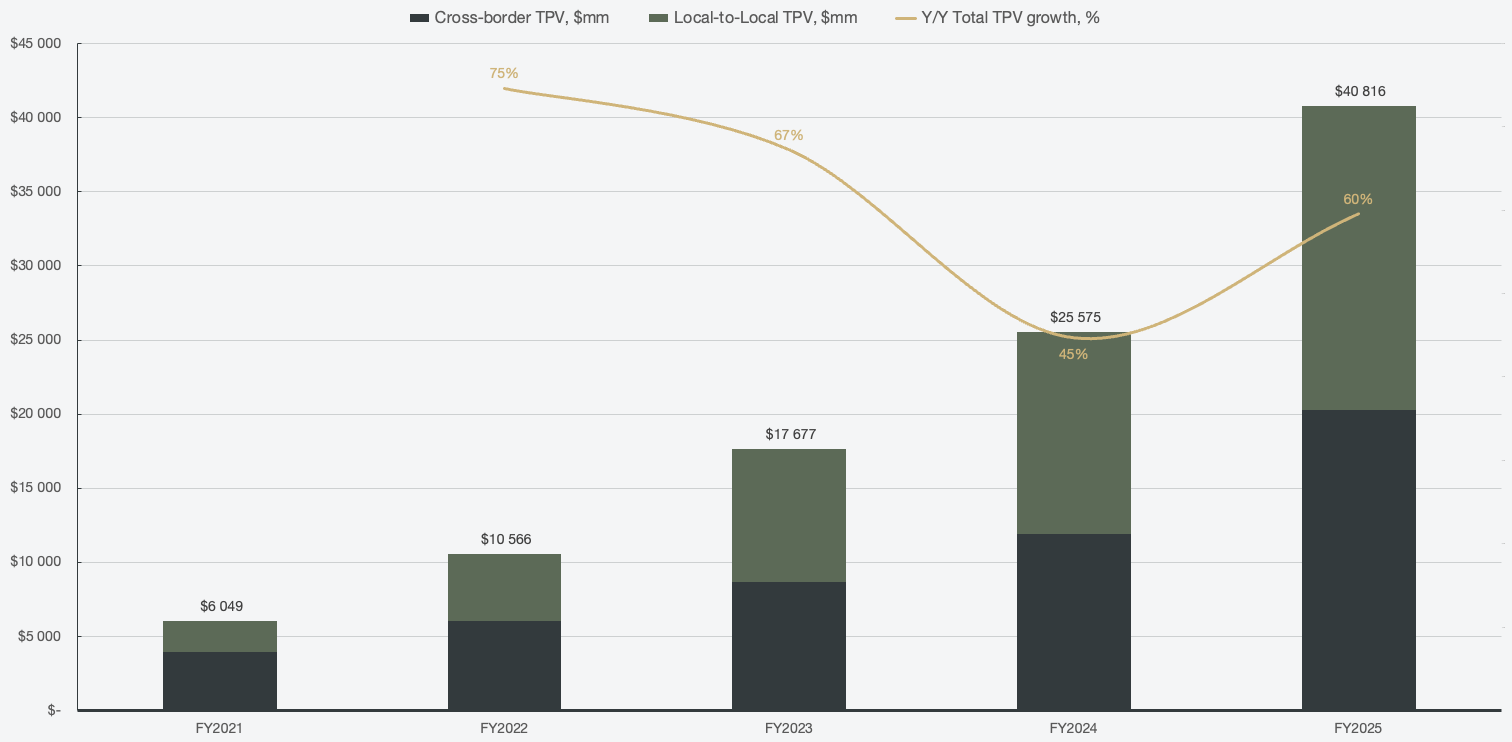
dLocal operates across many EMs, but to truly grasp how money flows through dLocal’s platform, it is best to visualize the payment volumes across a grid. One axis represents the geographies, while the other axis represents the direction of money. For the geographies, the payment volume is either cross-border or local-to-local. For the direction, money is either being acquired (pay-ins) or disbursed (pay-outs). These are not mutually exclusive, since each transaction is classified across both segments simultaneously. For example, a pay-in can be both cross-border and local-to-local.
Cross-border
A transaction where dLocal collects funds in one currency and settles them into a different currency (and typically a different geography).
Local-to-local
A transaction where dLocal collects and settles funds in the same currency.
The reason global merchants use dLocal in a geography where they have their own corporate entities is because of dLocal’s already present infrastructure. Despite having a local entity, having to integrate with various local payment methods, dealing with regulations, and obtaining licenses is a headache. Instead, they utilize dLocal’s “One API” platform, which is already built and operational.
Both segments are currently at a 50% split in terms of mix.
Figure 1: Geographically segmented TPV and TPV growth
Pay-ins
dLocal’s merchant customers receive payment from their end customers.
Pay-outs
dLocal disburses money on behalf of its merchant customers to the relevant business partners, suppliers, contractors, drivers, or customers.
Pay-ins have historically accounted for ~70% of the mix in the directional segment.
Figure 2: Directional segmented TPV and TPV growth
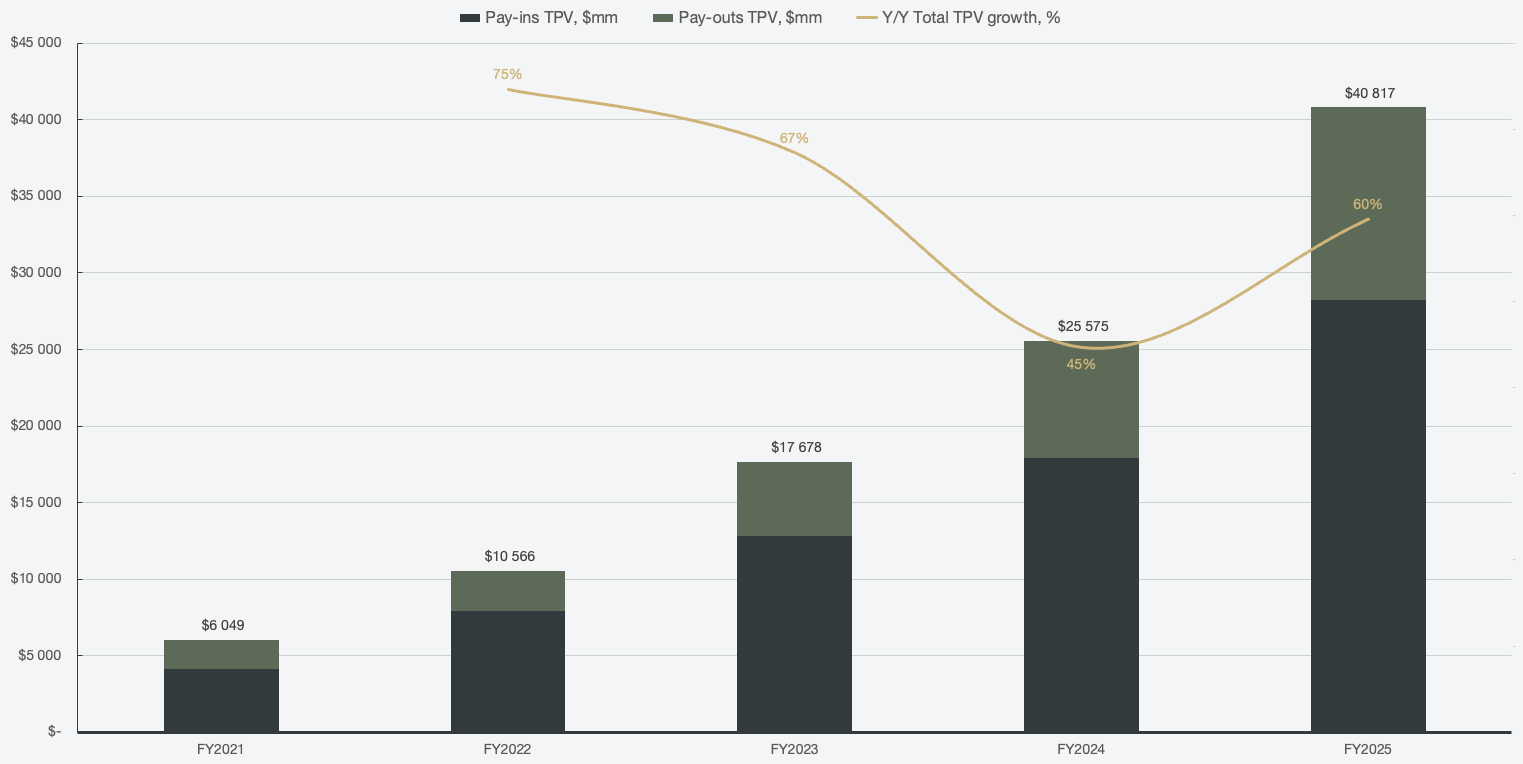
dLocal sees structural tailwinds and moats connected to local-to-local and pay-outs specifically, since those flows are harder for global players such as Stripe and Adyen to replicate without dLocal’s local licenses, APM network, and regulatory expertise. Shifting the mix towards that combination will result in stickier local flows and is a core part of dLocal’s “one dLocal” flywheel and differentiation in the EM space.
However, that is not the most profitable combination, which would be cross-border pay-ins. While management does not break out the specific take-rates tied to the TPV, they do provide brief commentary regarding positive drivers for net take-rates. Cross-border pay-ins benefit from the most monetizable variables across the TPV grid since it includes the inherently sticky nature of pay-ins, together with processing complicated FX spreads.
Local-to-local pay-outs, while over time will be a core driver, likely carry a lower margin since it is a focus segment. That does not mean “growth at all costs” where dLocal has to sacrifice margins extensively, but it means that they have to take a big enough market share among domestic rails, and also carry more processing and liquidity costs.
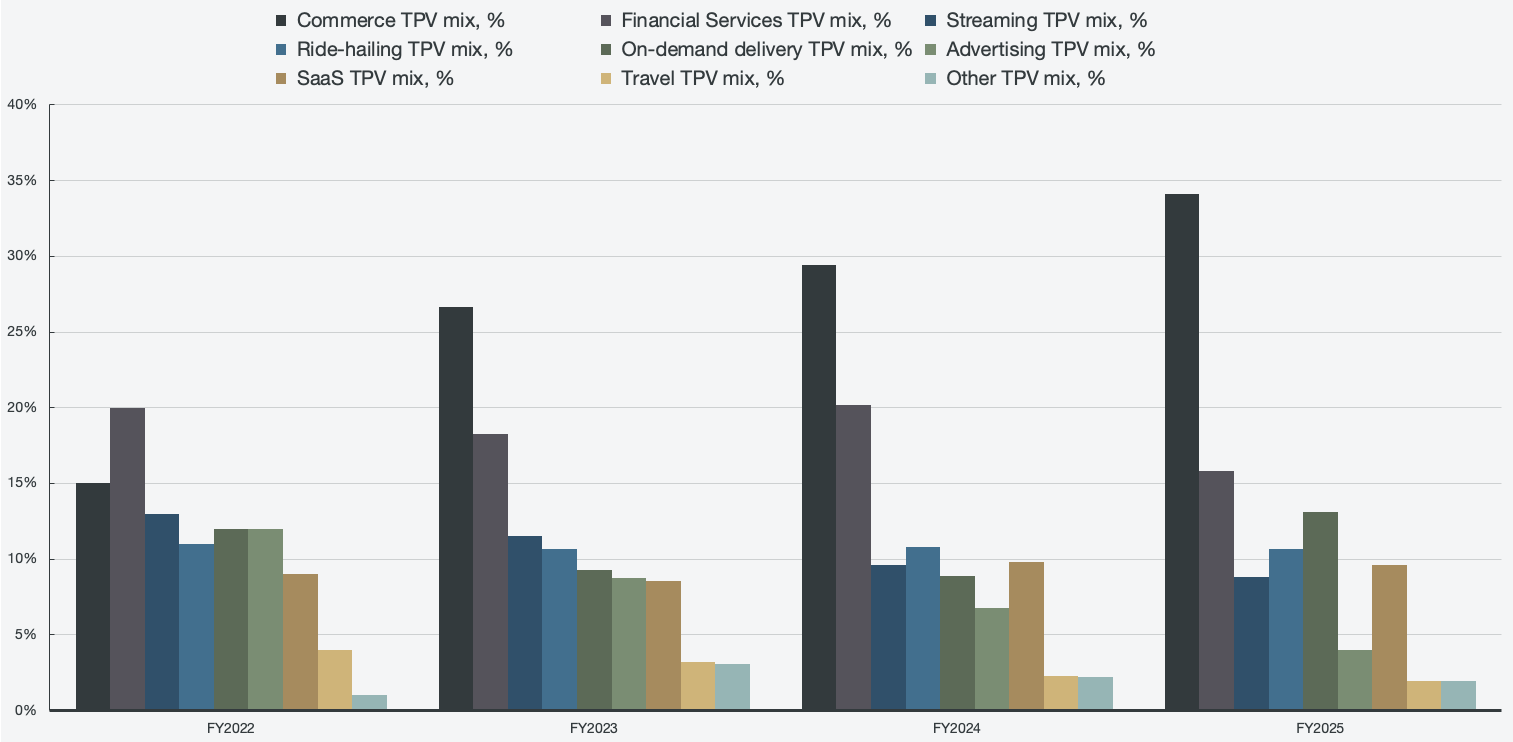
The payment volume itself is highly diversified across all parts of the economy, both across consumer categories and corporate categories. That means that TPV benefits from many parts of the economy growing in the EM’s, and the diversification means that there is less risk associated with the overall growth of the payment volumes. The only segment that has been actively growing its share across the TPV mix over the reportable periods is commerce, from 15% of overall TPV in 2022 to 34% in 2025.
Figure 3: Directional segmented TPV and TPV growth
If we look at what all the payment volume translates to in terms of revenue, it has been an impressive growth story, and a story that is not about to end anytime soon. Since 2019, revenue has grown at a compounded annual growth rate of 64%, which can be attributed to a variety of tailwinds and execution for the business.
Figure 4: Gross take rate and total revenue
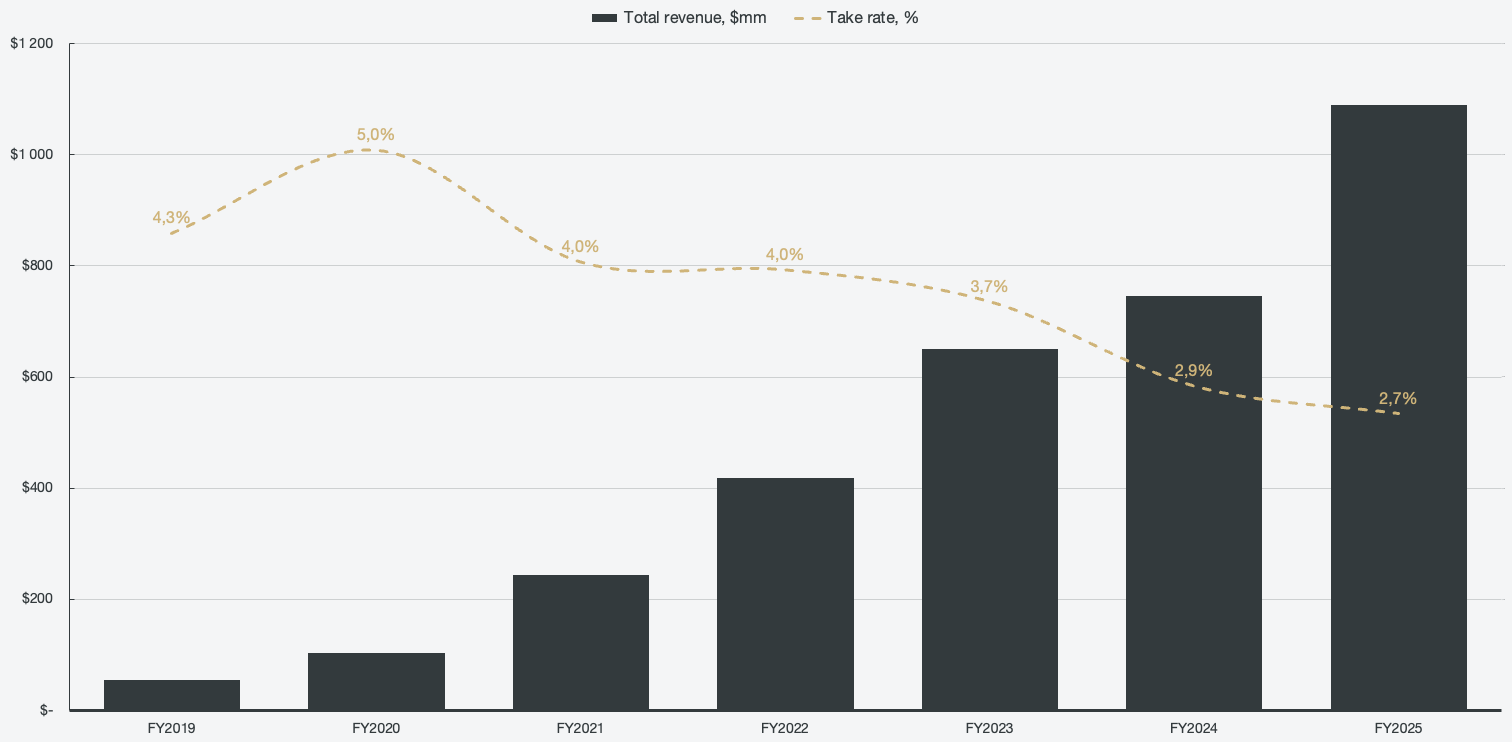
Seeing the gross take rate decline over time may seem alarming and a sign of competitive pressures. However, in dLocal’s case, it is a sign of scale rather than competition, unlike what may be observed in global payment service providers like Stripe, Adyen, and PayPal. The reason cited by management is that they favor payment volume growth over raw take rates, as it would impact prospects.
For large and scaling customers, there are volume discounts. As volume scales, the large merchants negotiate lower pricing or move to volume-tiered pricing, which is also favorable for dLocal since a large majority of both TPV and revenue growth is from existing merchants. Similarly, as the TPV mix shifts more toward pay-outs, it will have an impact on the take rates and margins due to being inherently less monetizable than pay-ins. The tradeoff is that it comes with stickiness and volume, which is still a favorable proposition for dLocal, and one that management embraces.
However, the take rate compression should start to slow down significantly as the mix starts to incorporate more profitable services such as BNPL, stablecoins, tokenized cards, AI routing, and more. In summary, deeper merchant relationships drive stickiness, which drives more volume, and in turn, provides more scale advantages. Winning the infrastructure layer in EM’s at a massive scale is more important than unit economics at this stage. That becomes very evident when viewing the source of growth, which is predominantly driven by existing merchants.
Retention is a core driver and a risk
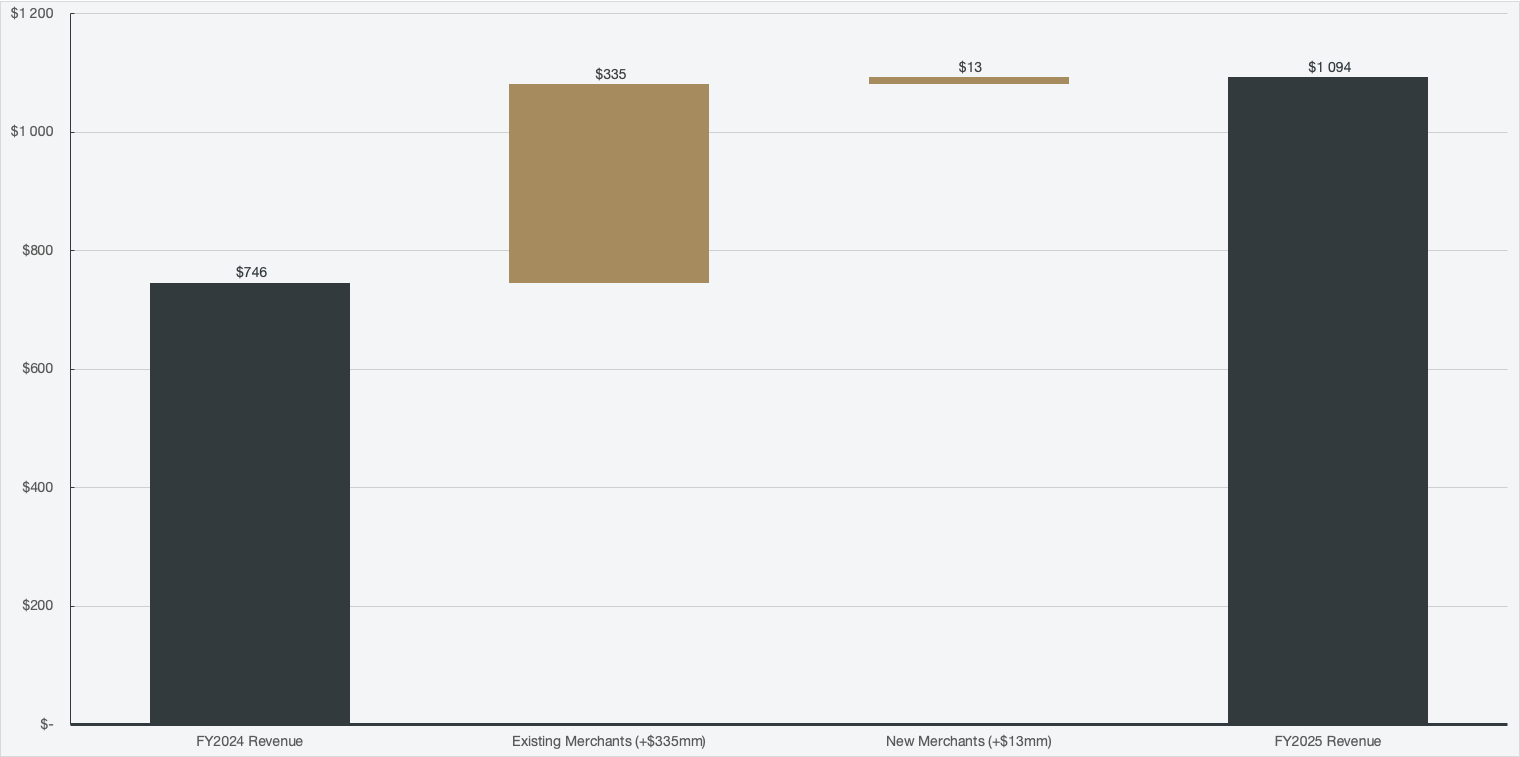
To get a sense of how important it is to nurture existing merchants and scale the relationship with them, we don’t need to look further than the revenue bridge between 2024 and 2025. 96% of the added revenue in the period was from existing merchants.
Figure 5: Revenue bridge (2024 - 2025)
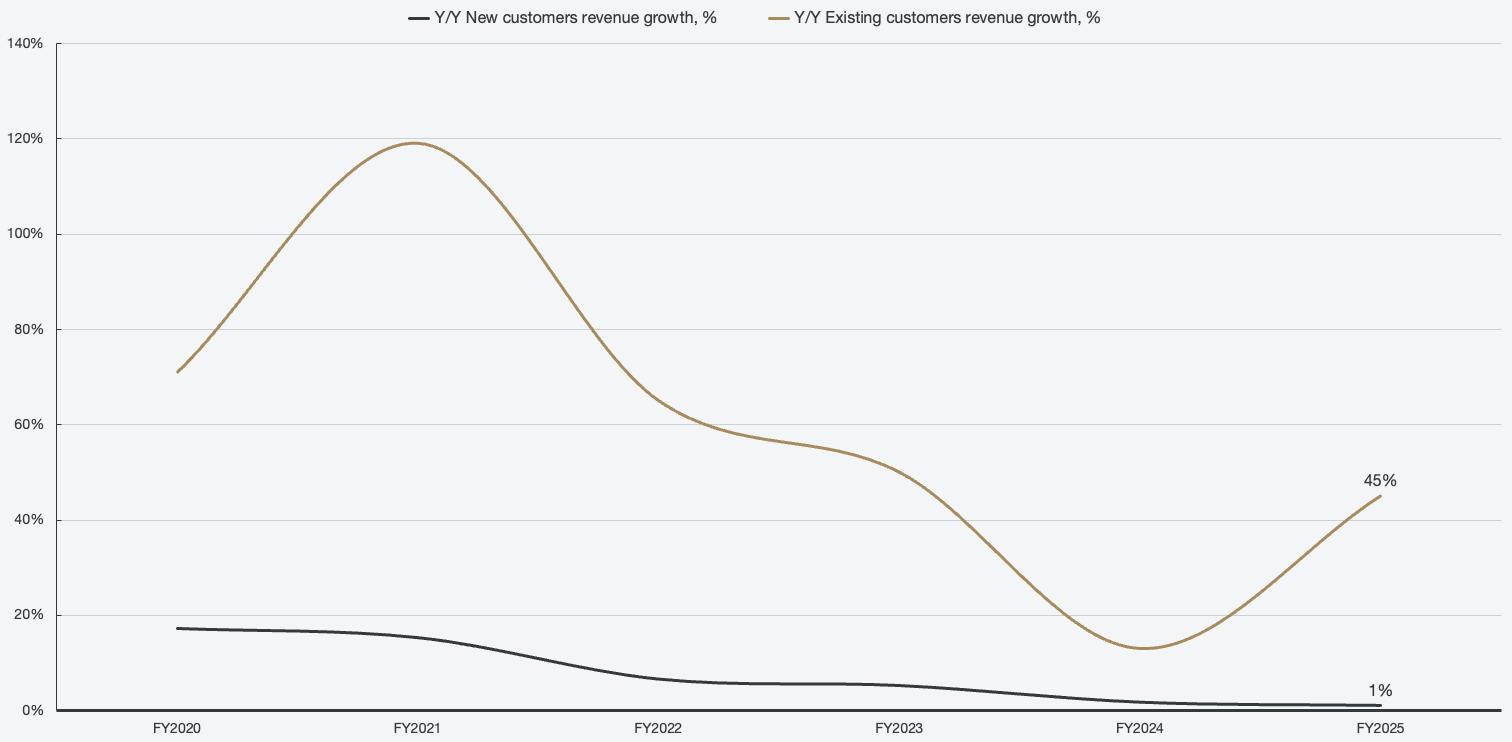
Looking at the net revenue retention over the past years, we can see that an overwhelming majority of growth is attributed to existing customers. By breaking it down into two cohorts of existing and new customers, the chart tells a clear picture of the importance of nurturing relationships with existing customers in order to drive growth for the business.
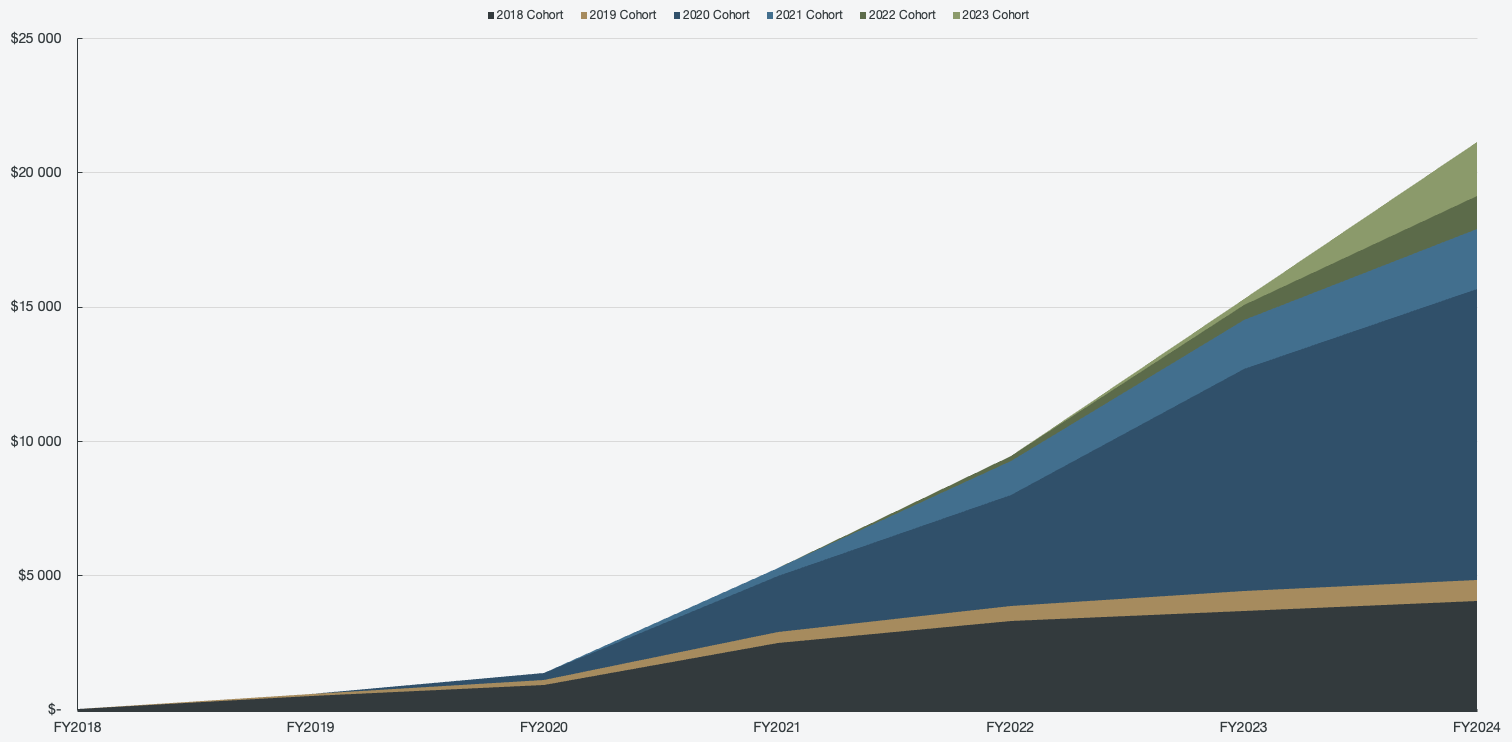
Figure 6: Cohort revenue growth
Historically, dLocal released merchant cohort data, which allowed us to track the “land and expand” go-to-market strategy. The 2023 cohort grew its TPV by a massive 719% from 2023 to 2024, and the 2018 cohort has grown at a 120% CAGR. However, as impressive as 120% CAGR is, the 2020 cohort has grown at a 154% CAGR. When viewed through this lens, it makes a bit more sense that take rates are taking a back seat in favor of scaling the payment volumes and deepening merchant relationships (making them stickier).
Figure 7: Total payment volume by merchant cohort, in $ millions