Exxon Mobil: Dominance Today And Tomorrow
Equity research report

Seldomly does one come across a century-old business that is still innovating and finding vertical growth opportunities, especially a business of massive scale. ExxonMobil generates revenue in the hundreds of billions, and that could be set to increase substantially as they target new opportunities with trillions in total addressable market.
In addition to pursuing growth, they are also bolstering their margins with significant efficiencies across the business and improved unit economics. At first glance, a massive oil and gas business does not seem too exciting; that is, until you discover the engineering prowess and ambition that ExxonMobil has.
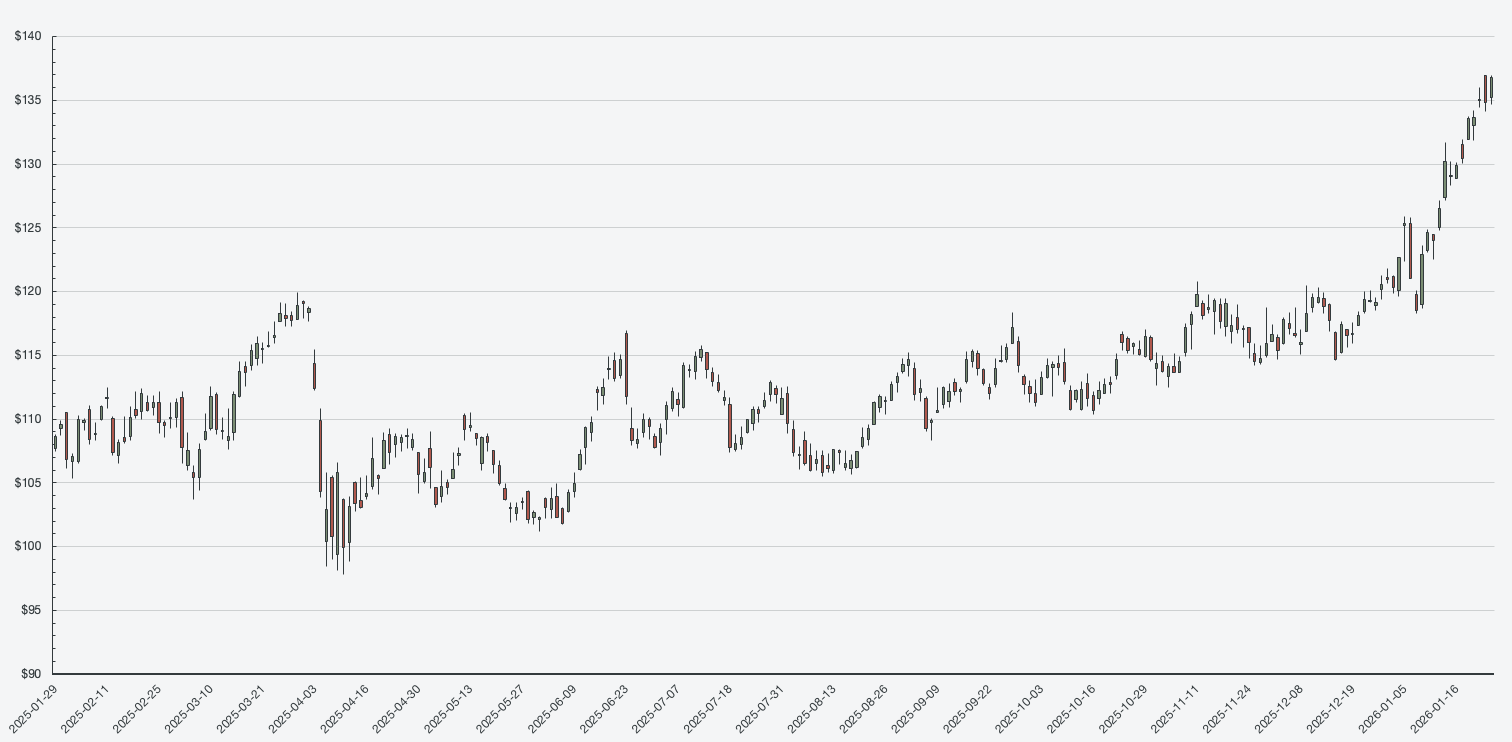
Price chart 1: Exxon Mobil Corporation, 1-year stock quote, USD per share
Company profile
Theme: Energy, Direction: Buy
Symbol: XOM, Exchange: NYSE
Sector: Energy, Industry: Oil & Gas Integrated
Fair intrinsic value: $138.12 (0.95%), as of January 28, 2026
Market capitalization: 586 274 million
Pricing data: P/S 1.76x, P/E 19.57x
TYPEFCAPITAL.COM
Consider following me on X and YouTube.
This article is for informational purposes only and does not constitute investment advice or an offer to buy or sell securities.
Positioned to capture the energy demand
Data centers demand exponential increases in energy consumption, but at the same time there is a push for decarbonization. Global energy output is effectively constrained due to these conflicting facts, but ExxonMobil is uniquely positioned to take advantage. There is a projected 15% energy demand increase in 2025 compared to current modern levels, with a heavy reduction in coal. Oil and natural gas are expected to remain more than 50% of the overall energy supply, but hydro, wind, solar, and geothermal are expected to triple.
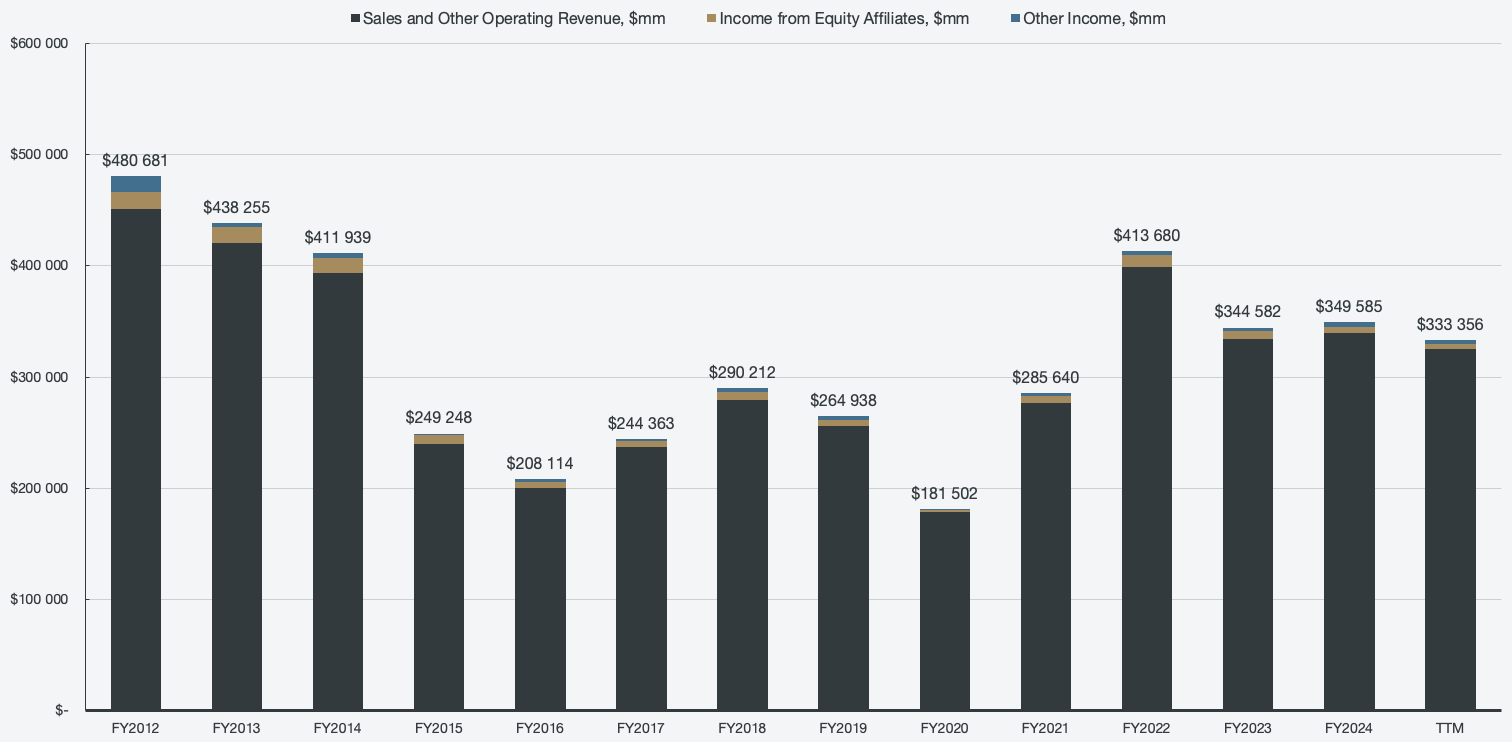
Figure 1: Total revenues
ExxonMobil operates vertically across the full energy chain, ranging from exploration to distribution and marketing. There are three main operating segments:
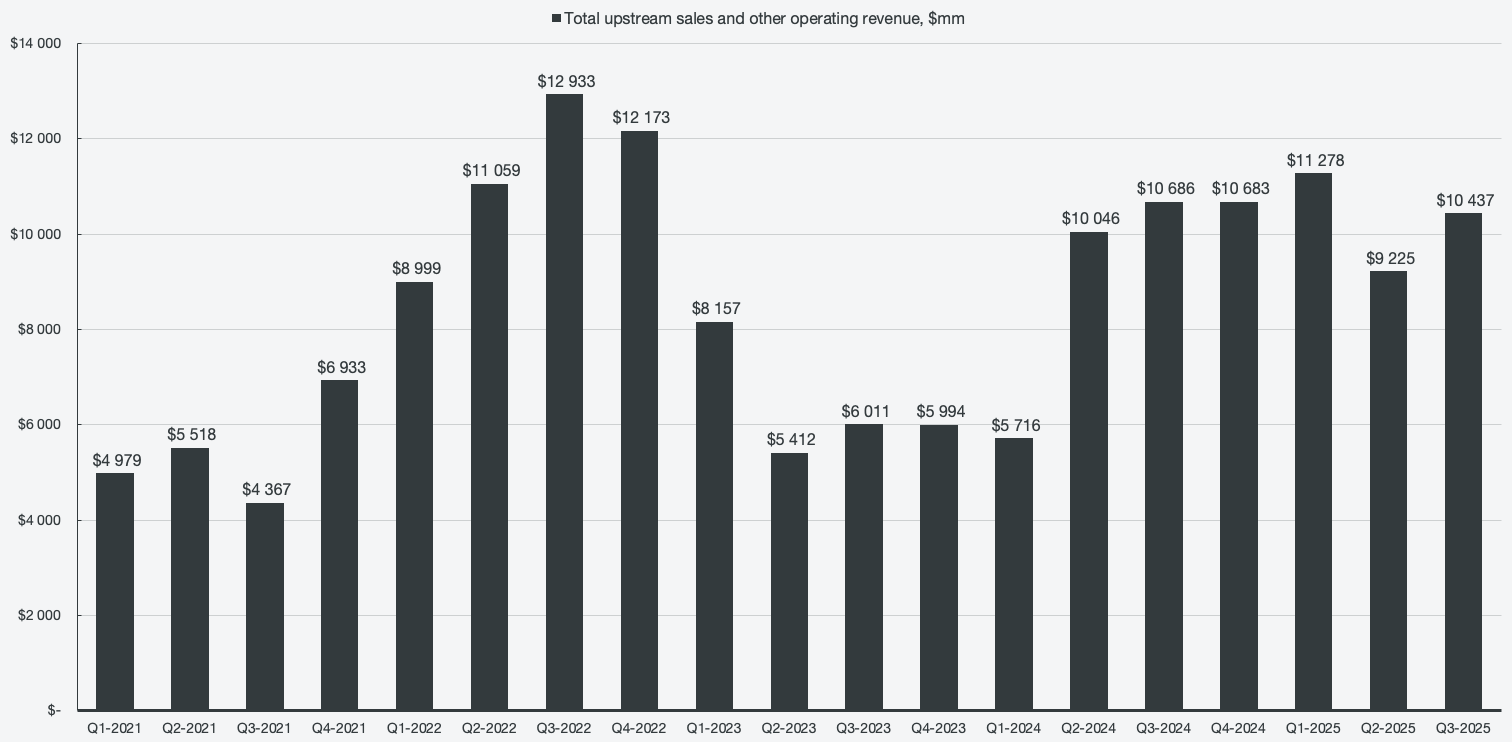
Upstream
Identifying, exploring, drilling, and extracting crude oil and natural gas.
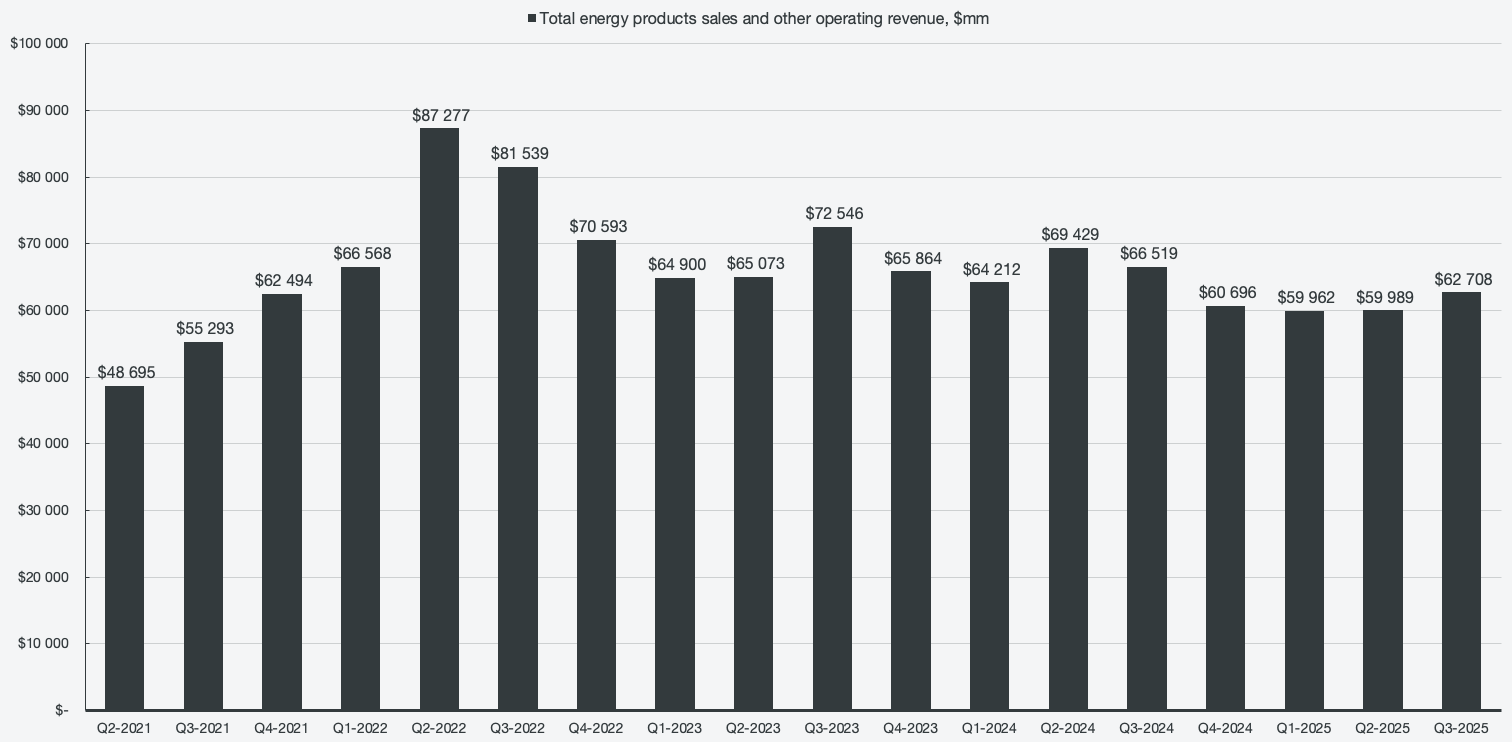
Energy products
Takes raw materials from the upstream segment and transforms them into products, such as gasoline, diesel, and jet fuel. The process involves distillation, cracking, blending, and associated logistics.
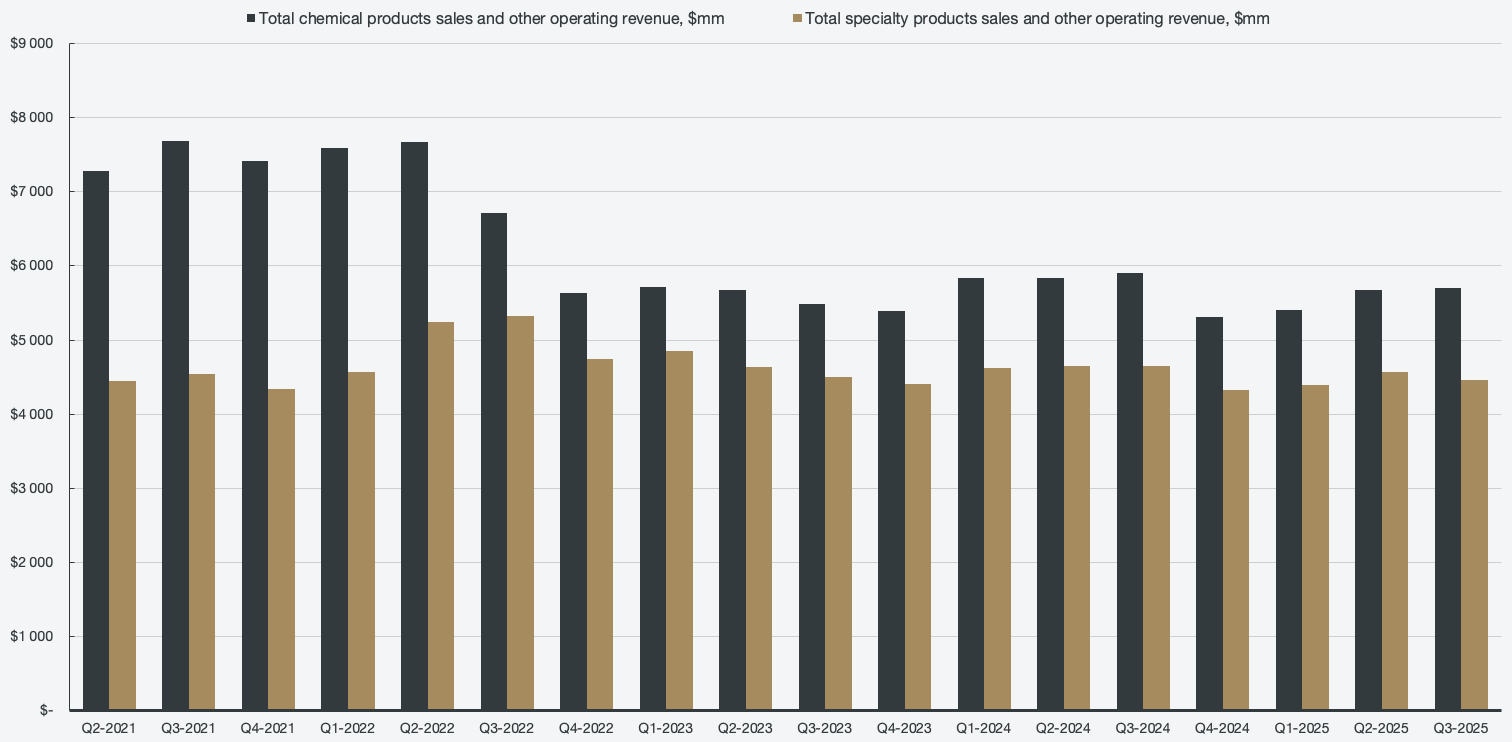
Chemical and specialty products
The chemical segment turns oil and gas byproducts into petrochemicals, which are the basic material needed for plastics, tires, packaging, and various medical equipment.
Specialty products focus on high-value fluids, such as synthetic lubricants, greases, waxes, and resins.
The large majority of ExxonMobil’s operations are tied to external factors, such as commodity pricing and economic outlooks. That translates to a highly cyclical business, which is also why total revenues ebb and flow. There are some built-in relationships within ExxonMobil’s segments that help mitigate some of the volatility in financial results. The cyclical nature of the business becomes very apparent when charting earnings before taxes (EBT) against WTI prices.
Figure 2: EBT and WTI correlation
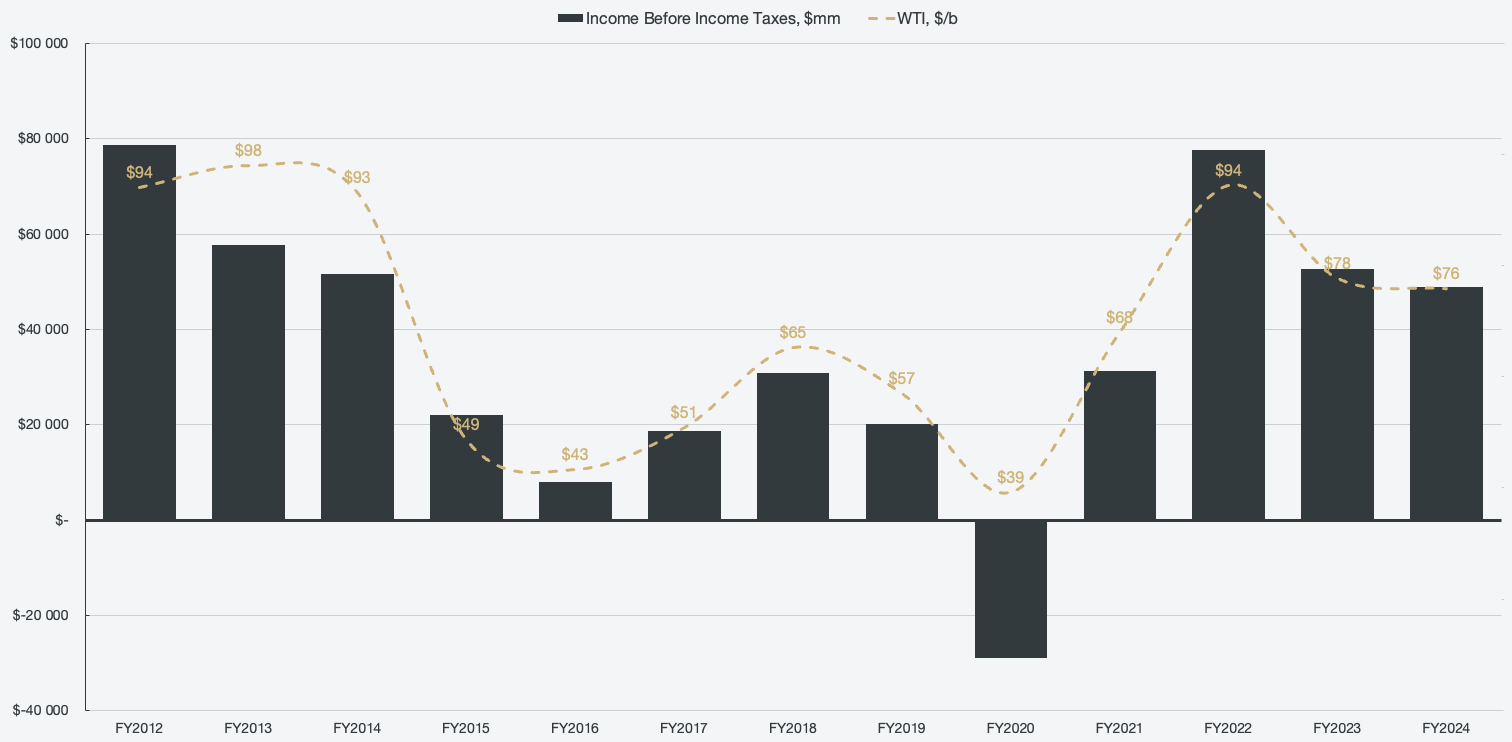
ExxonMobil can control the volume, but the overall margins and profitability rely on commodity prices. The corporate update plan shared with investors in late December outlines plans to target $400 billion in new opportunities by 2030. These opportunities will grow to an estimated $2.3 trillion by 2050. This will not only spur growth but also vastly increase profitability while further mitigating the cyclical nature of commodity prices.
The upstream segment is straightforward. Using seismic imaging, geologists find potential oil and gas reservoirs, which are then developed by engineers. After infrastructure is built (rigs, platforms, and pipelines), wells are drilled in order to extract oil and gas to the surface for separation. After water and other impurities get removed, the raw commodity is sold or forwarded to other segments.
Upstream is by far the segment that contributes the most to overall profits, but it is also the most volatile. About 75% of overall EBT is attributed to upstream, and it’s almost entirely driven by the price of oil and the Henry Hub. When oil prices spike, upstream generates large amounts of cash for the business, and similarly, if oil prices drop, ExxonMobil’s margins drop. If the price of oil drops significantly, for example, below $40 per barrel like in 2020, then ExxonMobil would lose money on each barrel that is being pumped.
Figure 3: Upstream revenues
If upstream is the largest cash generator, then energy products is the largest revenue segment. It typically accounts for about 90% of overall revenues but less than 30% of all profits.
The segment takes raw oil from upstream and transforms it into fuels. The process involves distillation, where raw crude is heated in large towers. The hydrocarbons get separated as they boil off at different temperatures. Heavy molecules then get broken down into higher-value fuels using heat and catalysts (cracking). After a blending process to ensure regulatory standards as well as branded requirements, different streams are mixed before the fuel gets shipped using pipelines, trucks, and ships.
The profit stems from the crack spread, which is the spread between crude oil and the price of fuels. Higher margins come from increased fuel demand, but sustained high prices can also hurt the margins if the cost can’t effectively be passed to consumers. While still very cyclical and subject to oil price collapses, the segment still benefits from cheap oil due to the input costs dropping. That helps mitigate some of the cyclical nature of the business and presents an avenue for profits even during downturns. Oil companies that only drill or only refine oil do not have this built-in hedge, but since ExxonMobil does both, it stabilizes the volatility slightly.
Figure 4: Energy products revenues
The two smaller segments are chemical and specialty products. For the chemical segments, gas and oil byproducts, such as naphtha and ethane, are turned into petrochemicals. Those are basic ingredients needed to create plastics, tires, and packaging. The feedstock is cracked 850°C, during which molecular bonds are broken into olefins. The smaller molecules then link together to turn into polymers, which are then used to create polyethylene and polypropylene. These can then be sold to companies to be melted or molded into various items.
The specialty products primarily focus on high-value lubricants, greases, waxes, and resins. The oil gets refined to a high purity to create base oils, which chemists then mix into complex additive packages. The fluids are then rigorously tested in harsh conditions to ensure performance. The specialty products are, as the name implies, specialized and branded, and as such are not as sensitive to commodity volatility as the other segments. The products are used in extreme conditions, where brand value is worth paying for. In general, specialty products deliver reliable profits with relatively high margins. While the products aren’t as sensitive to commodities, they are sensitive to global manufacturing and economies, where things like a drop in car sales can reduce demand.
Both the specialty products and chemical products are tied to GDP and consumer spending. Since it takes years to build out chemical plants, and decisions to build them are done years in advance, the overall industry is quite often oversupplied.
Figure 5: Chemical products and specialty products revenue
The future of the business and general profitability
ExxonMobil has shared ambitious plans that will drive the margin profile of the business a lot higher, while also accelerating the pace of normalized growth. The figures shared are on a normalized basis from 2024 levels, where management targets an additional $25 billion in earnings growth, as well as a $35 billion increase in free cash flow by 2030, totaling ~$70 billion. The normalization is necessary since the business is so driven by commodity prices. A $35 billion increase in FCF does not sound too impressive, since it would only mean an increase of $8 billion over an 8-year period from 2022, which recorded $62 billion in FCF. However, oil averaged around $100 per barrel during that period, whereas 2024 had a more normalized level of ~$75-80/Bbl.
The company largely plans to transform the business to substantially increase its financial performance by leveraging the advantageous assets in the Permian Basin and in Guyana, together with LNG. In addition to capturing new, currently dormant opportunities, the company will also perform structural cost reductions.
Since ExxonMobil acquired Pioneer Natural Resources in recent years, they are now able to industrialize the oil drilling in the Permian. Using a manufacturing mindset to shale oil, they can treat every well as a unique project where AI drilling techniques allow for multiple wells being drilled simultaneously in a standardized geometry. That in turn allows ExxonMobil to extract more oil, and at a cheaper cost per barrel compared to what competitors can do. Using supercomputers to optimize well spacing, they also avoid parent-child interference, which is when a parent well gets its oil stolen from a newly drilled well. The Permian is one of the most productive oil and gas regions in the world and also the highest-producing field in the U.S.
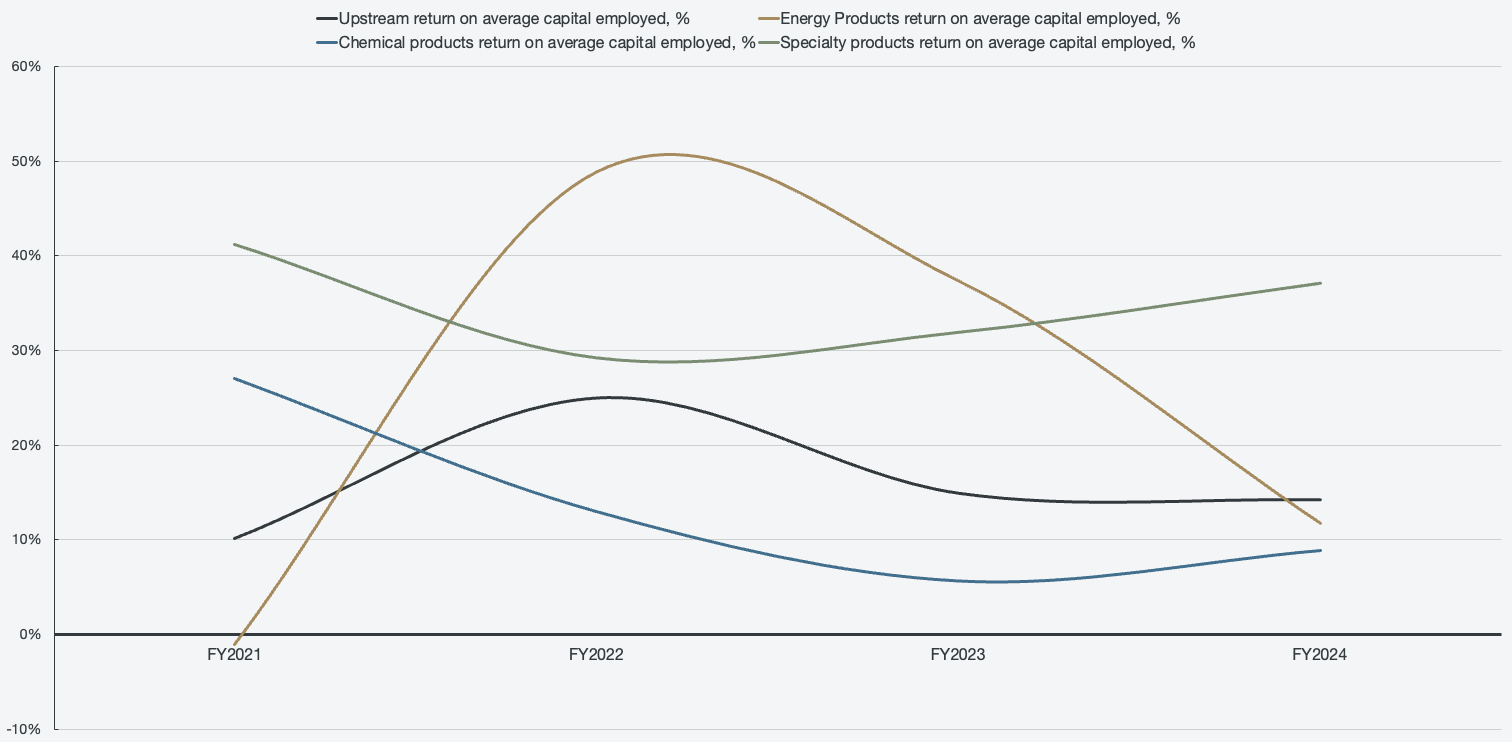
ExxonMobil already has the highest output of any company in the Permian Basin, and by scaling up efficiently, the break-even price for the upstream segment will come down significantly. If oil prices are healthy, the return on capital employed (ROCE) should be around 15-20%. If the prices are low and the company only operates at ~5%, it would be a major risk for the business, as the upstream segment is the highest contributor to profits. The ROCE metric is a good way to track if the Permian Basin developments are coming along according to expectations. If capital employed is increasing without an increase in earnings, it would signal that ExxonMobil is burning capital while operations stay stagnant (margin compression), which would be a red flag for the project.
Figure 6: Segmented return on average capital deployed