I have long put Meta in a basket I couldn’t see myself investing in, with its strengths inverted into weaknesses. For those familiar with my work, I tend to stay away from consumer-facing businesses because they are exposed to the world's most volatile variable: consumer behavior.
One bad headline can turn the business on its head, and Meta has faced its fair share of bad headlines over its lifetime. The business has dealt with everything from class action lawsuits to regulatory and political pressure. Even at the time of writing, cases against Meta remain open, but it's becoming increasingly difficult to ignore what may be one of the major winners in the AI race.
Company profile
Theme: Personal AI, Direction: Buy
Symbol: META, Exchange: NASDAQ
Sector: Communication Services, Industry: Internet Content & Information
Fair intrinsic value: $942 (+27.3%), as of October 7, 2026
Market capitalization: $1 898 840 million
Pricing data: P/S 8.23x, P/E 27.88x
TYPEFCAPITAL.COM
Consider following me on X and YouTube.
This article is for informational purposes only and does not constitute investment advice or an offer to buy or sell securities.
Acquire your threats
Meta’s family of applications serves over half of the internet-connected humans on Earth, and just when investors think the TAM might be getting exhausted, Meta finds new switches to pull and keeps growing. It all comes down to one key factor that has stayed present since its founding over 20 years ago: execution.
Figure 1: Total revenue and revenue growth
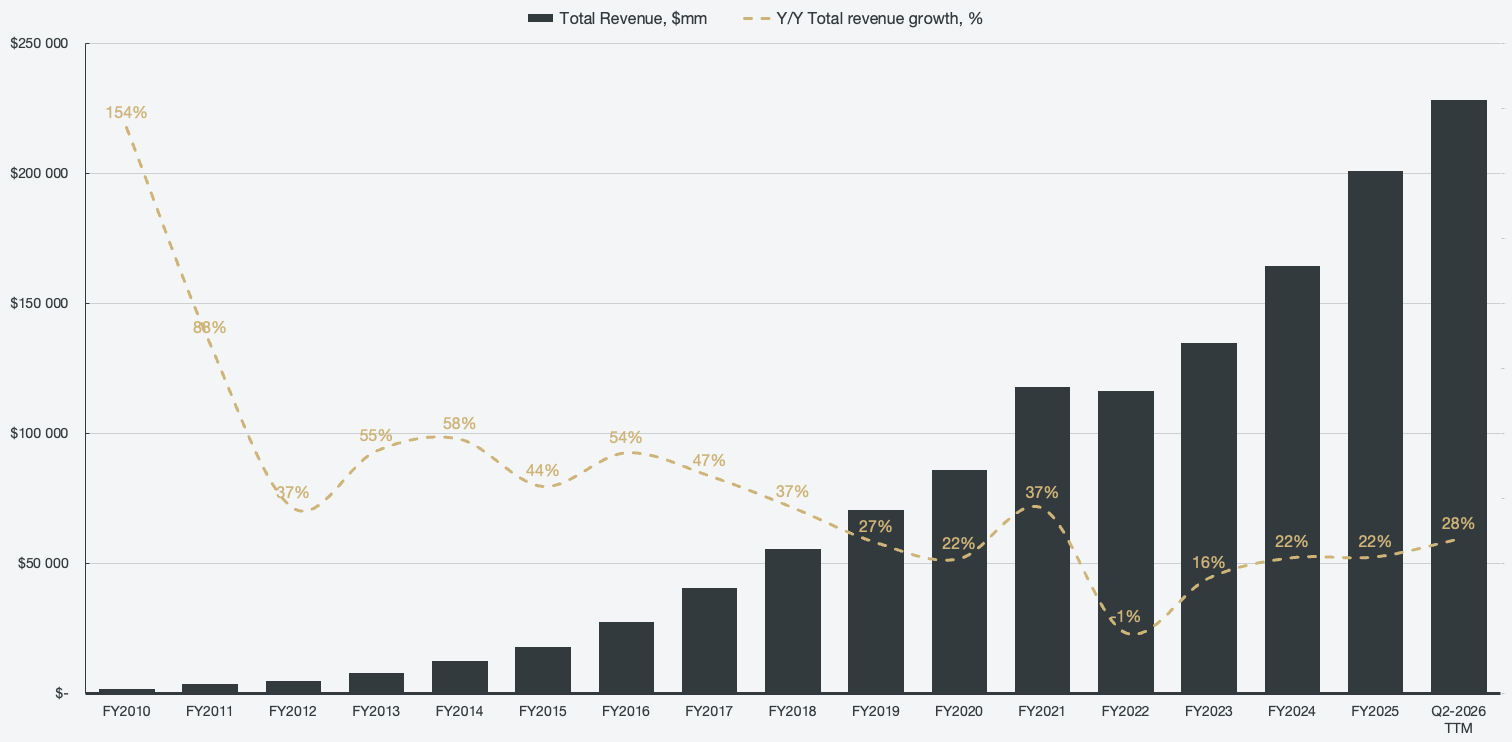
The vast majority of Meta’s revenue comes from its advertising segment, which has accounted for over 95% of revenue since 2015. The advertising franchise came primarily from two acquisitions that it expanded well, along with its ability to copy rivals quickly while leveraging its network. Meta's core advantage from its early days was real identities. Users signed up using real names and connected with their real friends. Together with the Facebook News Feed, the company could produce a social graph and a stream of declared interests that no other platform of its era had access to. Next, it acquired two major threats before they grew large enough to pose a real threat: Instagram in 2012 for ~$1 billion, and WhatsApp in 2014 for ~$19 billion. Both were then scaled on Meta’s infrastructure, identity layer, and ad stack. Fast forward to today, and three of the four largest social and messaging applications outside of China sit on a single ad system run by Meta.
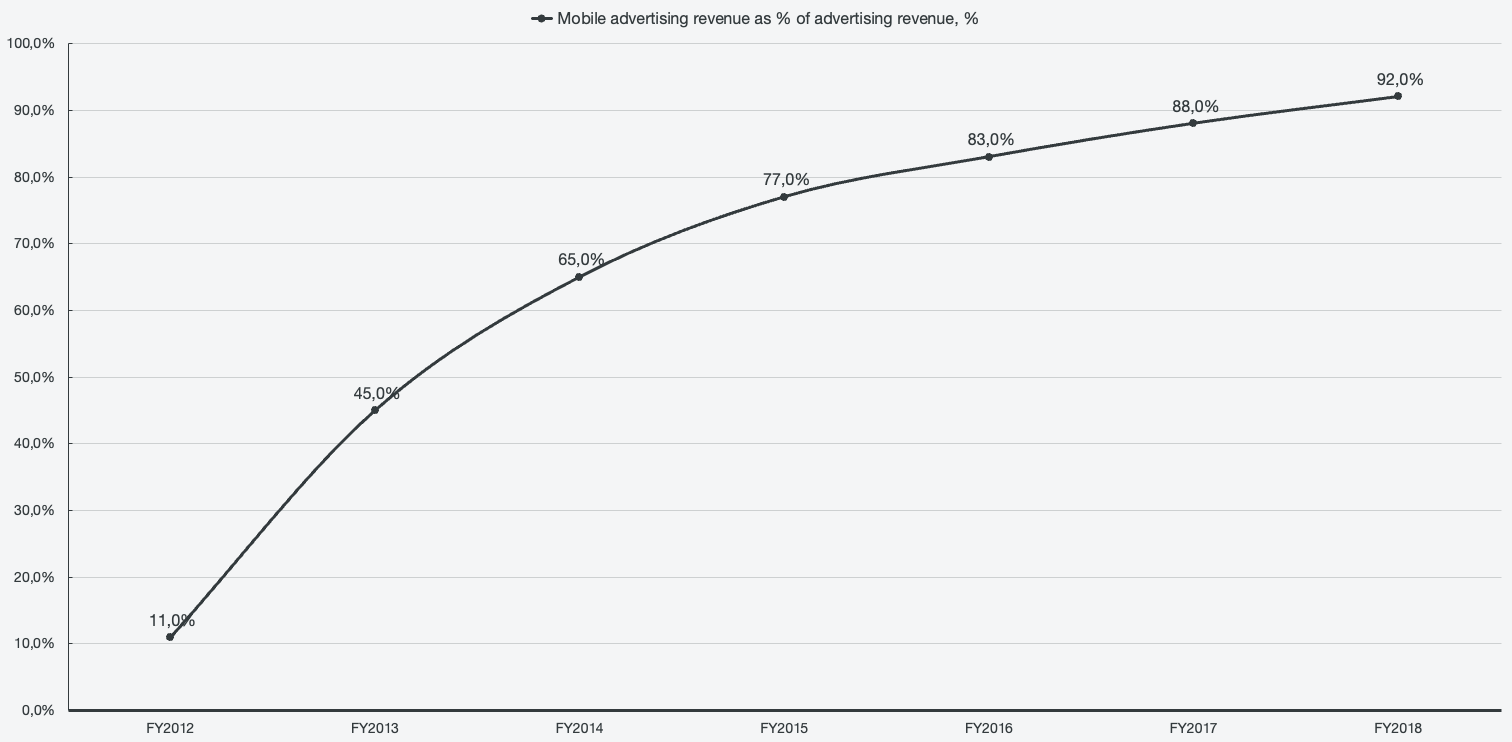
The core of the success comes from execution, and Meta’s record is unparalleled in the space. In 2012, Facebook became public and had close to no mobile monetization, with Mobile accounting for ~11% of ad revenue that same year. By 2018, Mobile accounted for ~92% of ad revenue, the result of one of the fastest platform transitions any company of its size has ever executed. Threats have emerged throughout its history, and when they couldn’t be bought, Meta copied them at scale. Snapchat’s Stories format was the first of its kind and quickly gained traction, but Instagram promptly introduced it and soon surpassed Snapchat’s user base. In 2020, Instagram launched Reels as the answer to the quickly growing video-sharing platform TikTok, which today carries a large and growing share of time spent inside apps among consumers.
Figure 2: Historical mobile advertising as a percentage of total advertising revenue
Every step of the way has brought thorns to Meta’s side, but it somehow emerges stronger from each setback. In 2021, Apple introduced its App Tracking Transparency (ATT), which meant that Meta lost signal and took a visible hit to its ads business in 2022. It then rebuilt how it targets and measures users using its own AI models, resulting in an even stronger product with less reliance on third-party data than before.
In essence, there are three factors that compound Meta’s dominance:
The applications share one backbone and one ad system. Each addition to the system raises the value of all applications instead of splitting the audience and the attention.
Meta has a dual-class share structure which gives Zuckerberg control. This means that the CEO can align the business for long-horizon bets without fear of public-market pressure or activist investors causing hindrances. Examples include what Meta paid for Instagram in 2012, which seemed controversial at the time. A present-day example includes AI-related capital expenditures.
Reach. The distribution across Meta’s family of applications is incredibly vast, and reaches all parts of the world. For example, WhatsApp gives Meta distribution in emerging markets where it serves as the main communications layer among both consumers and businesses.
Competitors typically have one of these advantages, but Meta remains the only company with all of them at scale, which is also why the Family of Apps keeps taking share of the ad market despite already being the largest.
Advertising breakdown
Meta’s family of apps segment accounts for 99% of total revenue, of which 98% is advertising revenue. So how does the advertising machine work? In short, Meta runs auctions for ad impressions across its app feeds, Stories, Reels, Threads, and more recently, WhatsApp Status. Like many recent ad businesses I’ve written about (AppLovin, Google), an advertiser picks a sales, lead, app install, or awareness target, sets their budget and creative assets, and then Meta picks which users to show it to. The price an advertiser pays is set by competition in the auction process. Auction winners result from predictions of the probability that a specific user will take action when presented with the ad. This generates two key metrics for tracking the performance of the ads business: ad impressions, which are driven by users and their time spent on ads, and the average price per ad, driven by advertiser demand and how accurately the system predicts conversions.
Figure 3: Average price per ad growth and ad impression growth
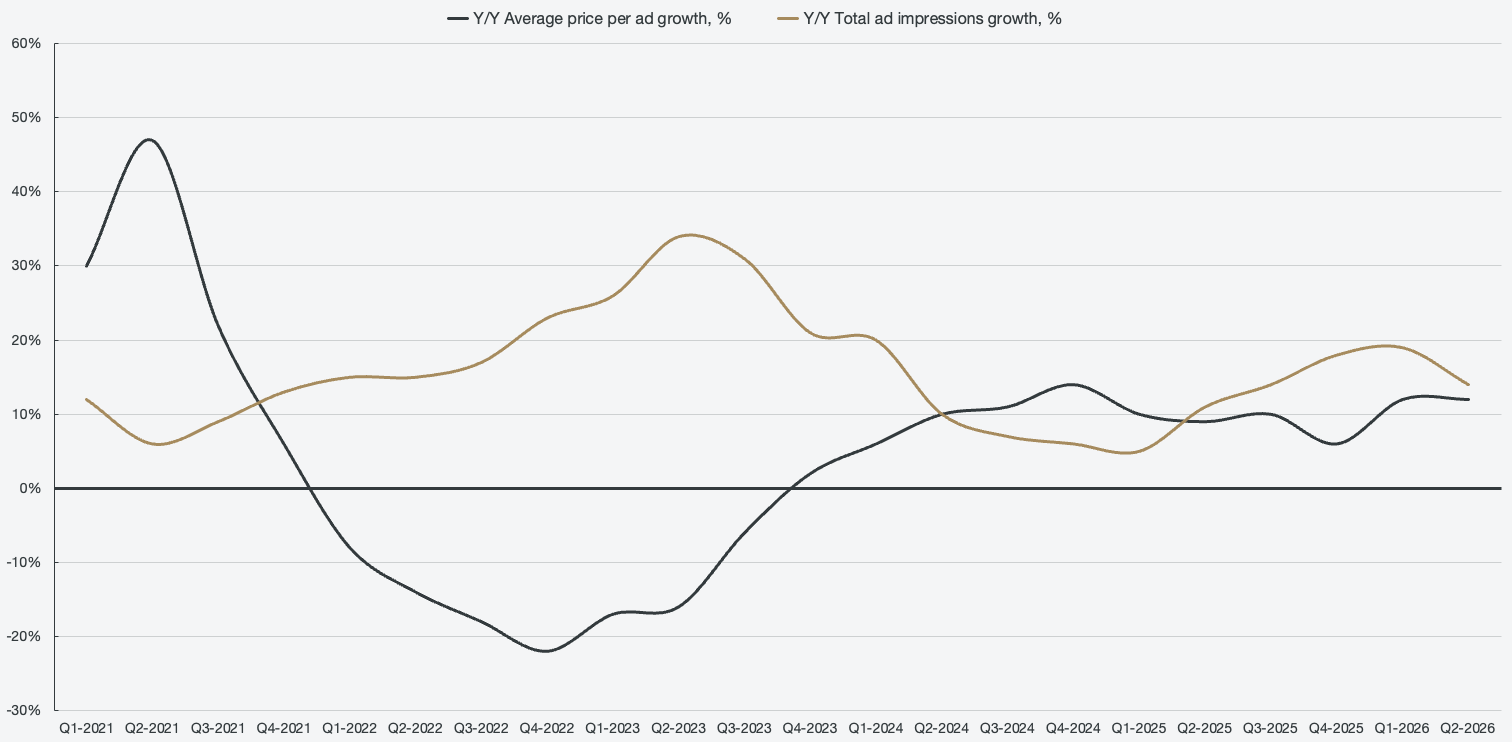
2022 and 2023 price per ad growth shows just how Apple’s ATT cut the signals that Meta uses to measure conversions. The price per ad fell for seven straight quarters, and the business only grew by pushing more impressions through Reels at lower prices. By the end of 2023, average price-per-ad growth began recovering as Meta rebuilt the system with AI algorithms, and growth has stayed strong since, averaging above 10% per year.
Meta’s moat lives inside these two levers. Combined with the largest first-party engagement dataset on earth, Meta developed three distinct AI models that have elevated the whole segment. Andromeda is used for ad retrieval, and GEM for ranking and sequence learning. Meta Generative Recommender, which uses LLMs to reason about ad content and user preferences, is the differentiator across a field of many competitors. Better predictions raise conversion rates, which in turn raise return on ad spend for advertisers and, as a result, how much they are willing to bid in the auction. That self-reinforcing loop is fueling both ad impressions and average price per ad growth to stay above 10% simultaneously, and together it produces the 20-30% advertising revenue growth we’ve seen over the past year.
Figure 4: Advertising revenue and advertising revenue growth
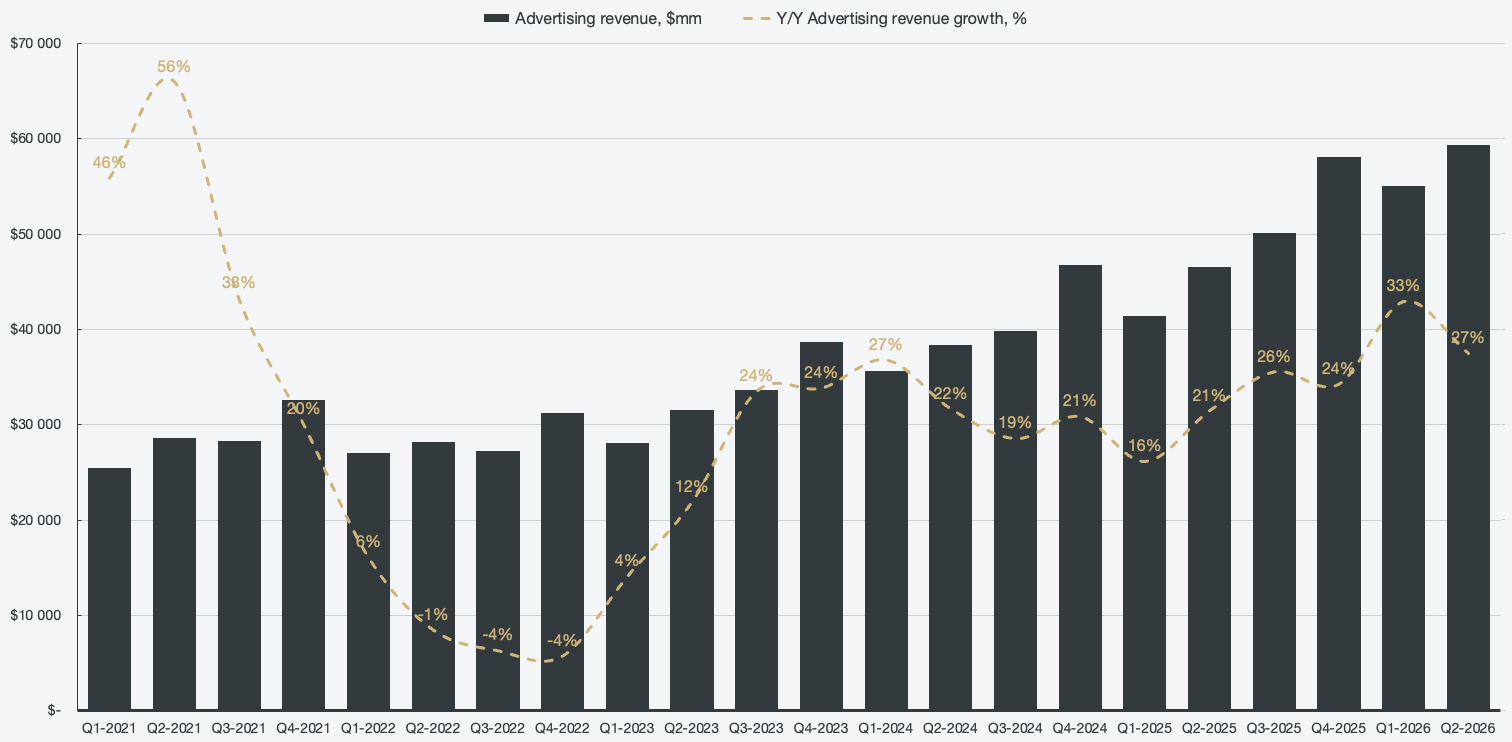
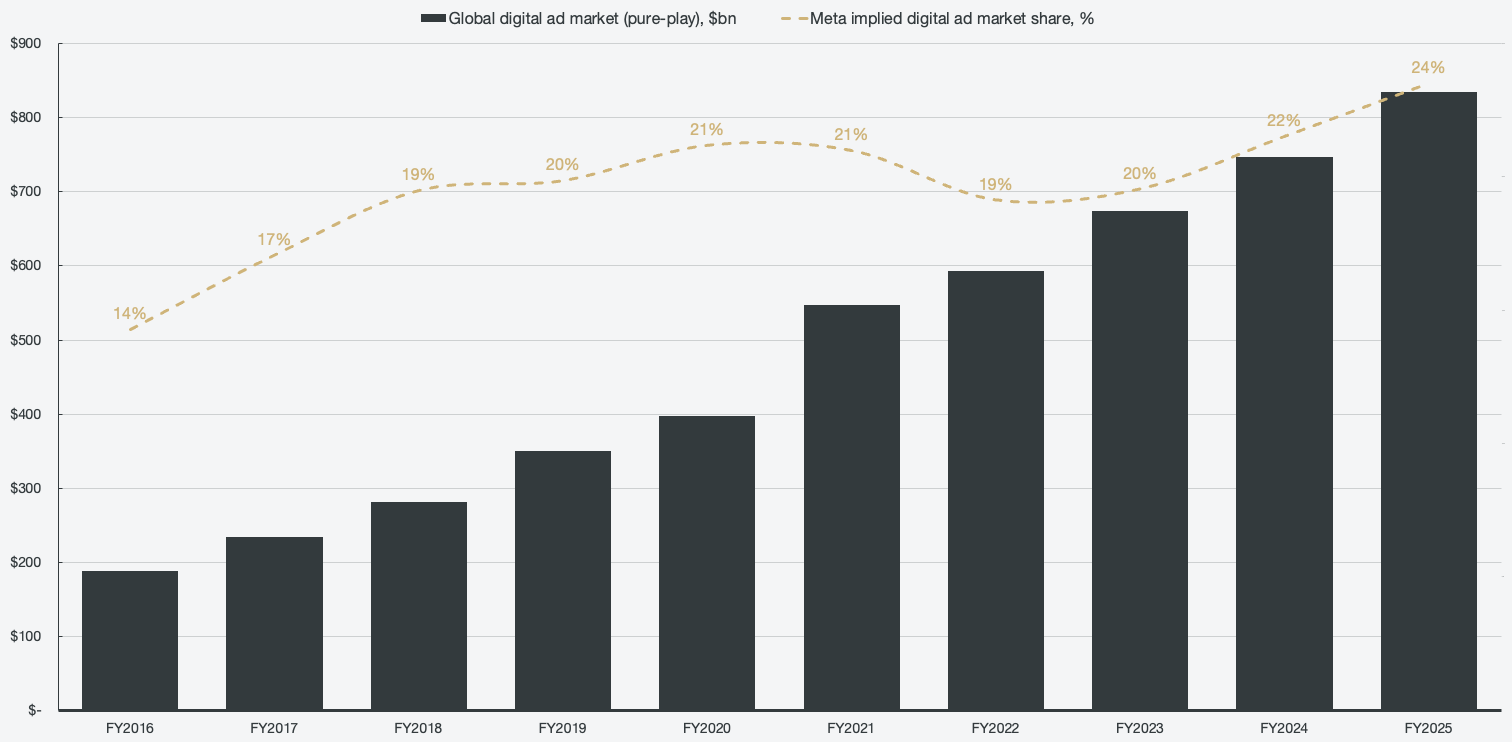
So how big is the market? Using global ad market estimates by WPP Media, it has grown in the high single digits over the past 10-year period on average, reaching ~$1.15 trillion in 2025. Looking specifically at the digital ad market, it grew from ~$188 billion in 2016 to ~$835 billion in 2025, an 18% CAGR, including a massive COVID-19 rebound in 2021 that saw the market expand by 38%. Over that same 10-year span, Meta grew its share of the pure-play digital ad market from 14% to 24%, up 200 basis points from 2024 to 2025. It has taken the most market share over the past 10 years against a strong roster of competitors. Alphabet (Google), which is the largest seller of advertising, shrank its share from 42% in FY2016 to 35% in FY2025.
Figure 5: Implied Meta market share of global digital ad market