

Palantir Technologies: Positioned For Dominance
Initiating equity research coverage

Palantir is a software company that has gone against the grain throughout most of its existence. They have seen themselves as years ahead of the software industry, often citing that they deliver software products before the customers themselves know that they need them. Palantir’s unique approach of defining what the future of software should look like has positioned them to be the biggest beneficiary of the AI revolution that is now occurring.
Company profile
18 July, 2025 Initiated coverage
Direction: Hold
Previous fair intrinsic value: N/A, as of N/A
Symbol: PLTR, Exchange: NASDAQ
Sector: Technology, Industry: Software - Infrastructure
Theme: AI Software
Fair intrinsic value: $71.06 (-53.85%), as of July 18, 2025
Market capitalization: $393 108 million
Pricing data: P/S 126x, P/E 678x
TYPEFCAPITAL.COM
Consider following me on X and YouTube.
This article is for informational purposes only and does not constitute investment advice or an offer to buy or sell securities.
Key growth drivers
In order to get a sense of what future opportunities look like for Palantir, we can extrapolate addressable markets as well as potential market shares of these. The primary drivers which can be extrapolated are the AI software market, as well as the Department of Defense budget.
Recent global conflicts have shown the importance of AI solutions in warfare. From solving logistics and targeting to decision-making, the range of applications is wide and is likely to dictate the future of modern warfare. Palantir does not disclose revenue sources; they only provide geographical financial data based on segment. If we use Palantir’s U.S. government revenue as a proxy for the DoD, we can start to look at an approximate market share of the overall DoD budget.
Over the next 10 years, I have forecasted Palantir’s U.S. government revenue to compound at an annual rate of 37.9%. This might sound high, but once the market share is extrapolated as a measure against a DoD budget forecast, it does not seem nearly as enthusiastic. From a base of 0.14% market share as a total of the DoD budget, my forecast for Palantir’s U.S. government revenue reaches 2.73% in 2034.
Figure 1: Forecasted U.S. government market share of DoD budget
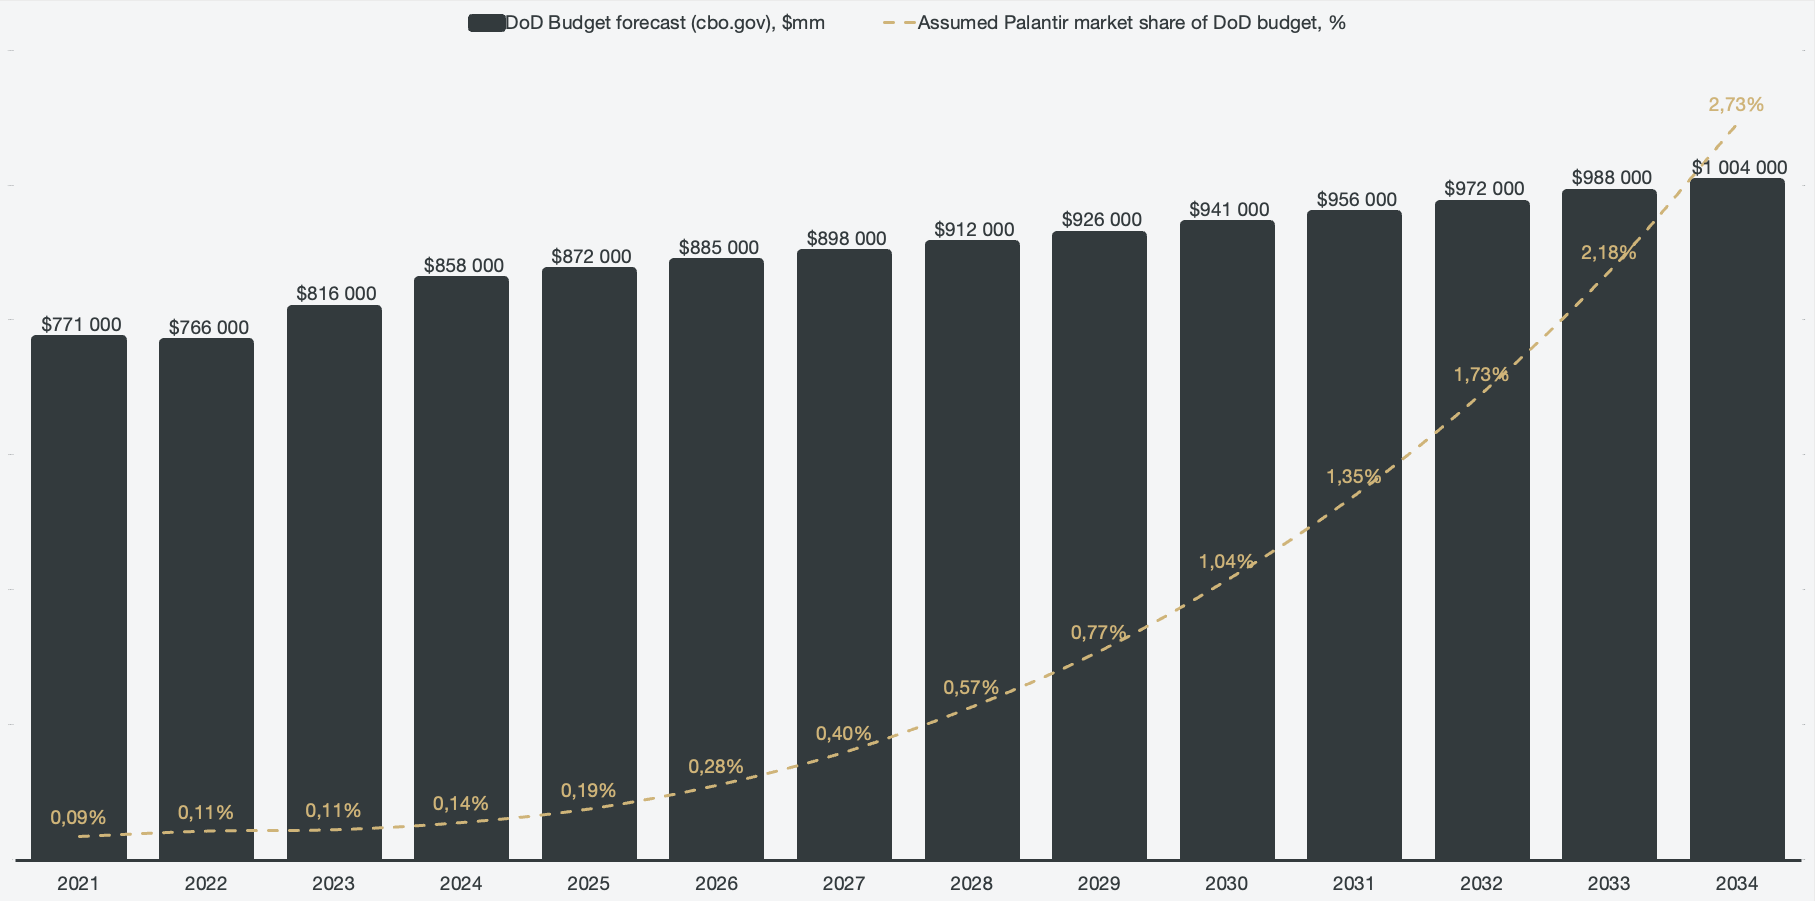
This forecast assumes that the U.S. DoD increases its spending on AI solutions, in which Palantir, as a software prime, is poised to be the primary beneficiary. However, a 2.73% market share may seem very low in 10 years time, considering that Palantir is deployed across more than 15 different government agencies with an increased reliance on the company's solutions. An assumed 40% compounded annual growth rate translated to 4% market share of the DoD budget, a plausible claim in our view.
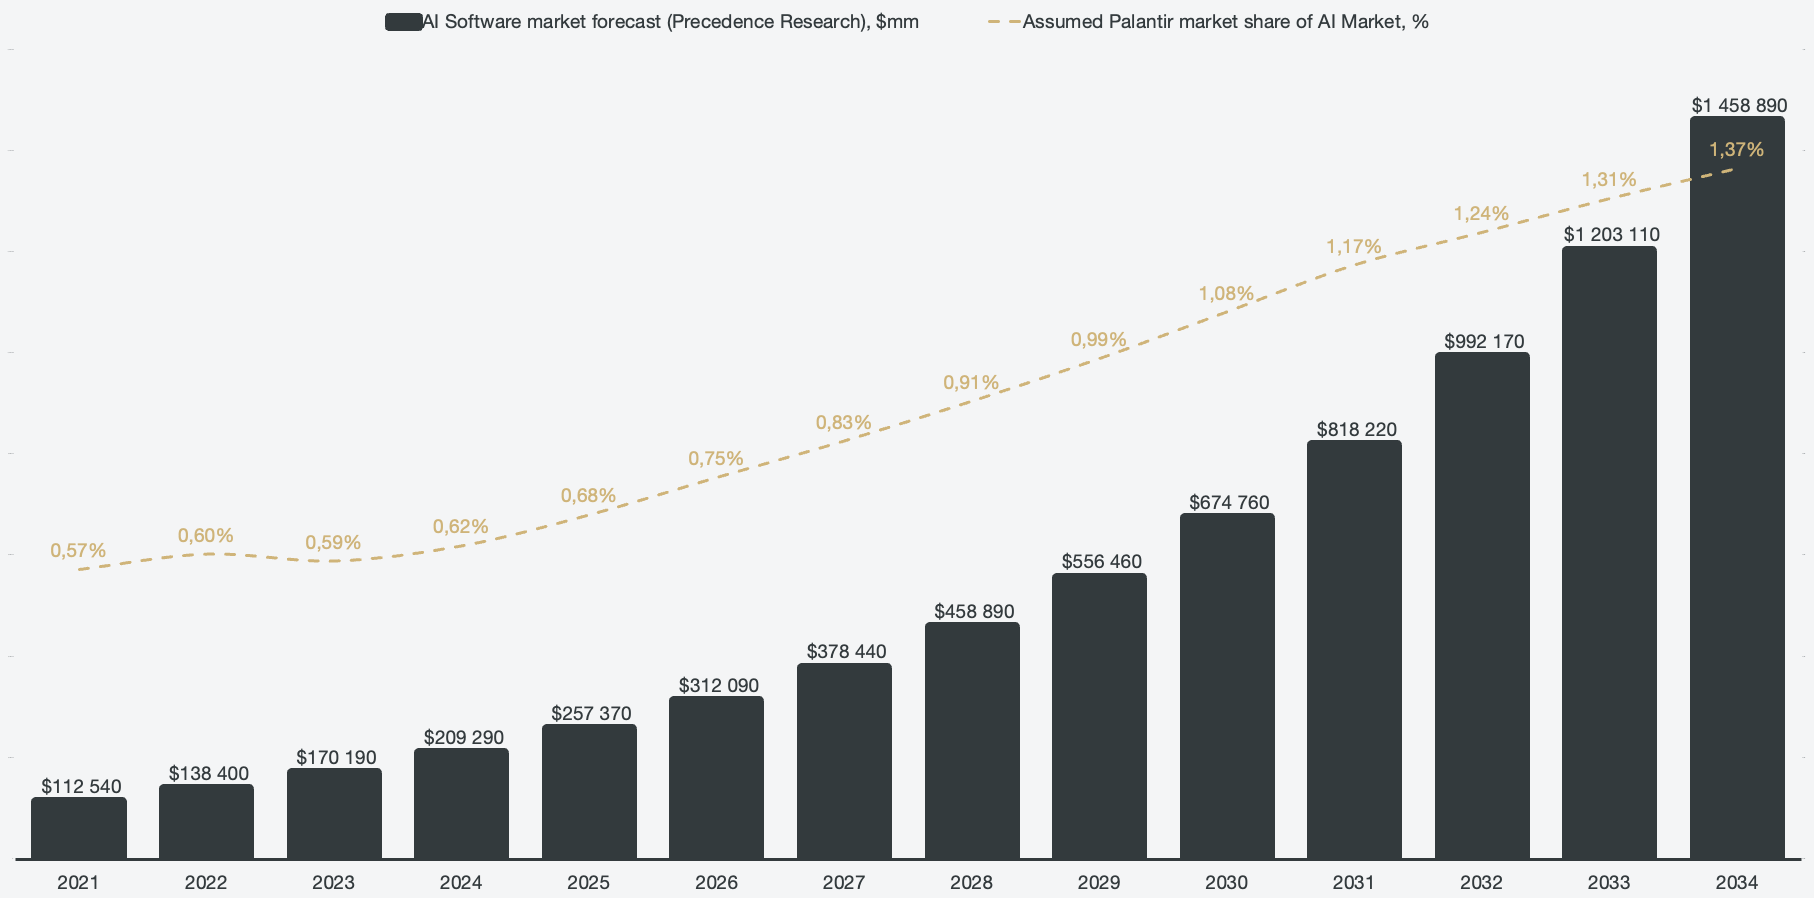
Similarly, we can extrapolate Palantir’s commercial business against the AI software market as a whole. According to Precedence Research, the AI software market is currently set to grow at 21.26% CAGR until 2034, of which Palantir held a 0.62% market share in 2024. My intrinsic valuation assumes an average 32.3% CAGR for Palantir’s commercial business, resulting in a 1.37% market share in 2034. Given Palantir’s dominance within the AI space on the commercial side, this can also be argued to be quite low. Compounding at a 35% rate would result in a 1.65% market share, also a scenario that can plausibly be argued for.
Figure 2: Forecasted commercial market share of the AI software market
Investors may have concerns over the sustainability of the growth rates that Palantir is currently exhibiting, but once measured against the addressable market, I assume that the growth runway is significant.
Quality of growth and efficiency
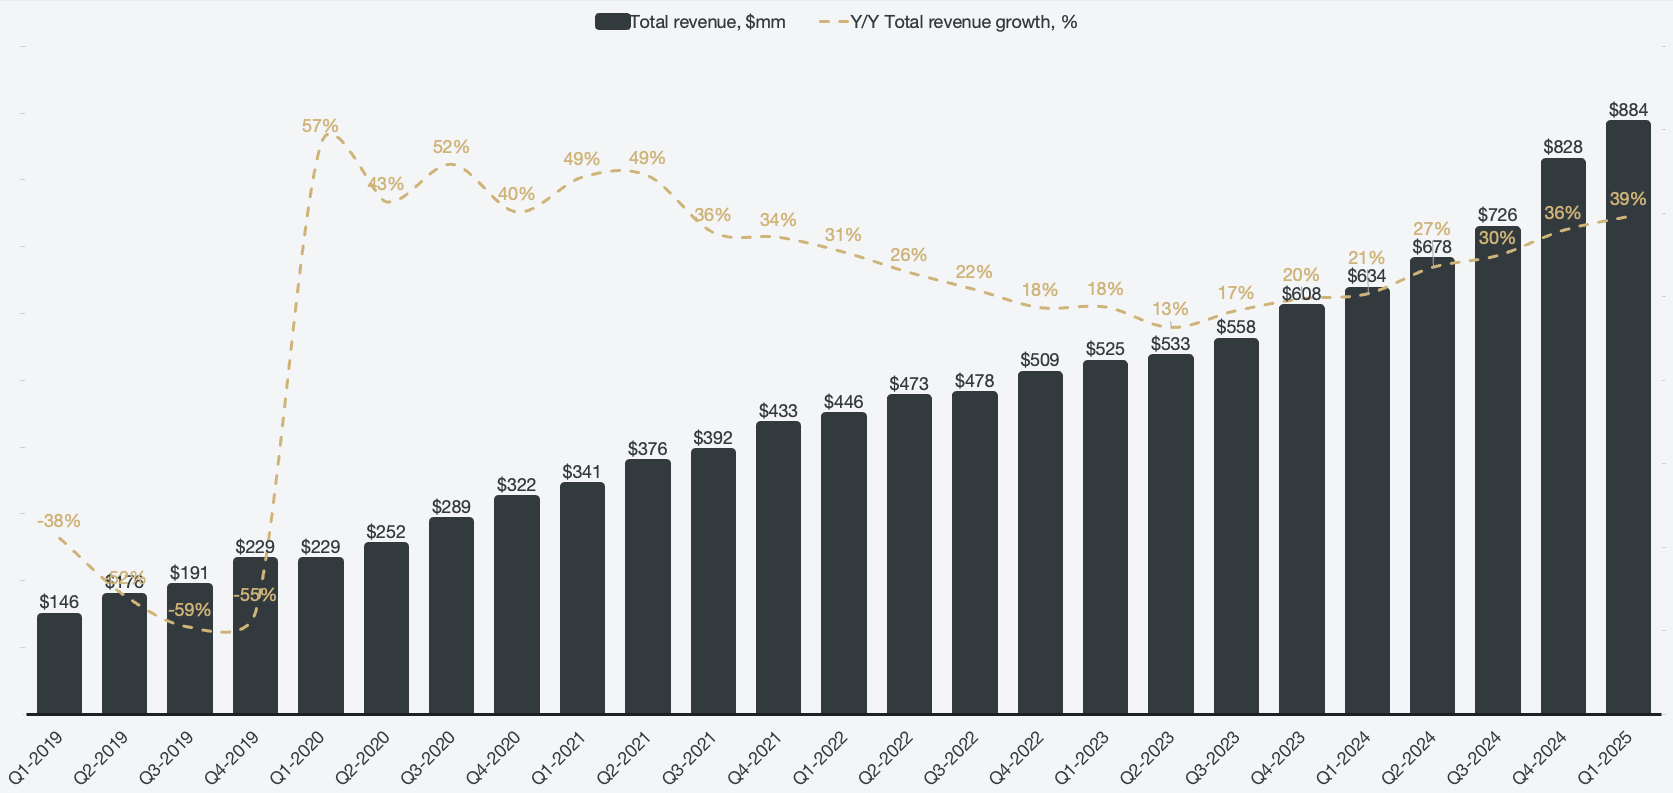
The company launched its AIP product within the first half of 2023, which also marked the end of a downtrend in revenue growth.
Figure 3: Historical revenue growth
In addition to launching AIP, Palantir also introduced a new go-to-market strategy with bootcamps. Bootcamps are an extremely efficient way that resolved many of Palantir’s sales problems. Previously, Palantir had issues getting its software into the hands of businesses and lacked a way to prove the value that the software could provide. Bootcamps present a way for a concentration of clients to get hands-on experience with the software and actually build useful solutions within a 1-3 day span. This has proven to be a very cost-effective and efficient way to sell software for Palantir.
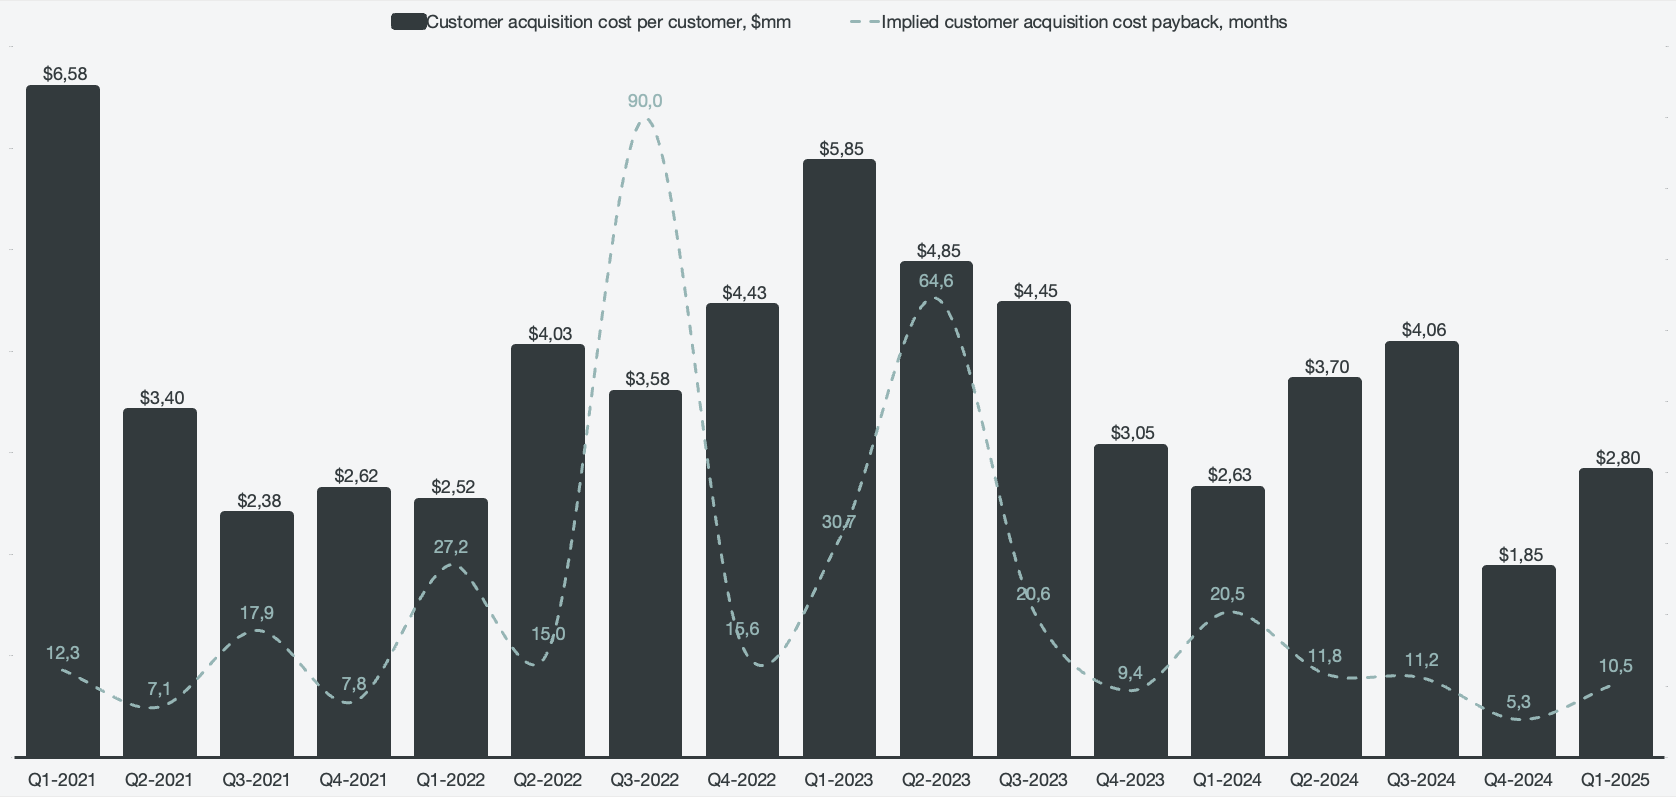
This presents itself in the numbers by looking at the customer acquisition cost ever since Palantir launched AIP and started to utilize bootcamps. The following chart is skewed in the periods prior to 2023 because Palantir acquired customers by investing in special purpose acquisition companies, where the SPACs would sign contracts for Palantir software in return. However, by looking at 2023 and onwards, there is a clear overall downtrend in customer acquisition cost, proving the sales efficiencies introduced with bootcamps.
Figure 4: Customer acquisition cost and implied payback time
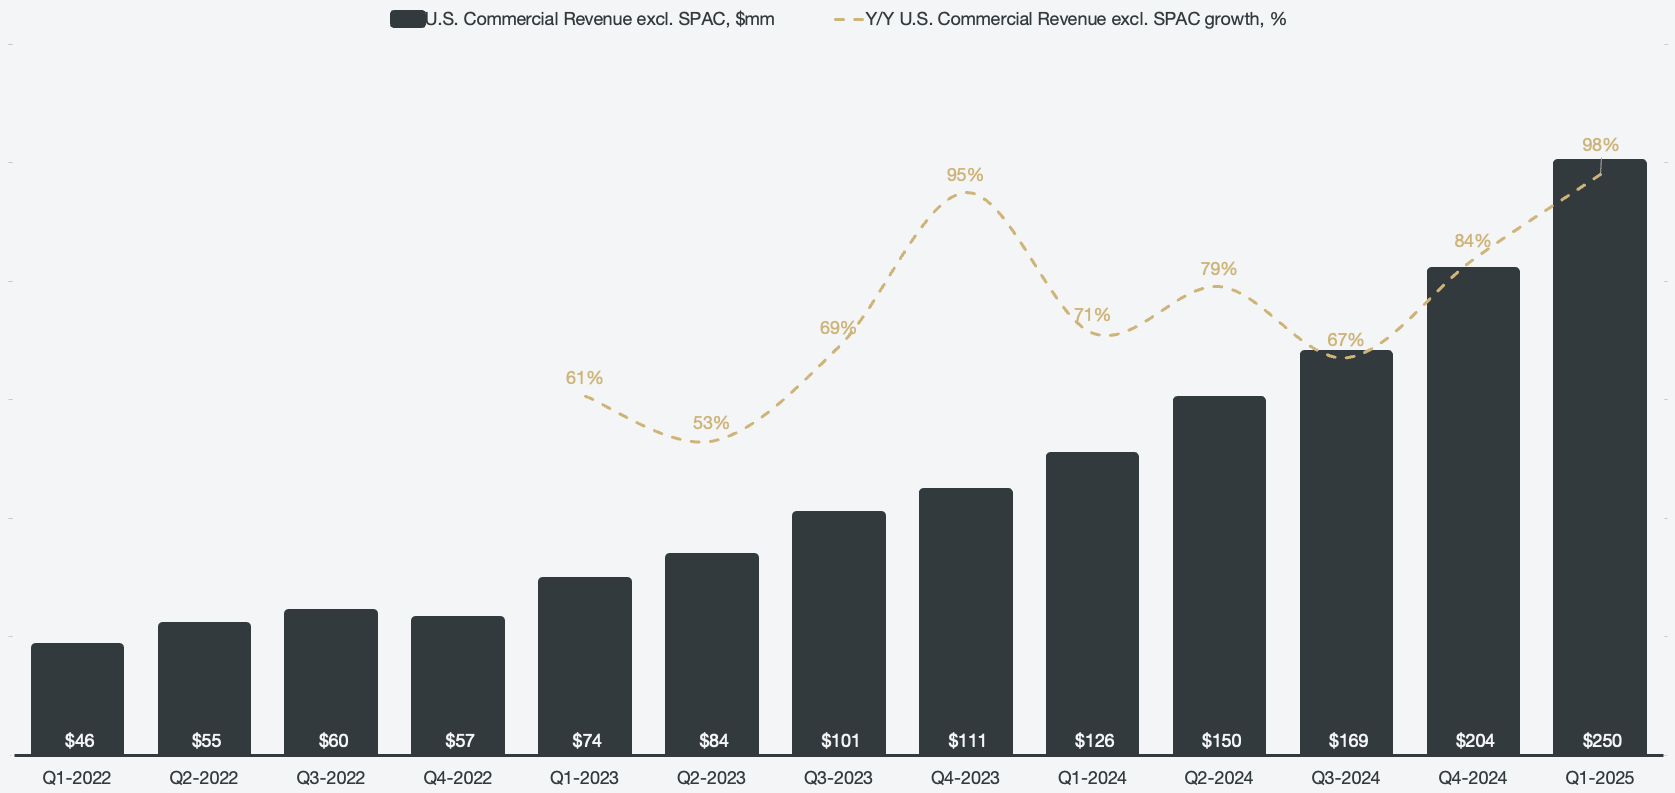
The segment which has benefited the most from bootcamps is the U.S. commercial segment, which has seen explosive growth since the introduction of AIP. Excluding inorganic revenue from the SPAC contracts, Palantir grew ~100% in Q1 of 2025, compared to a period that grew 71% year-over-year in Q1 of 2024.
Figure 5: Organic U.S. commercial revenue growth
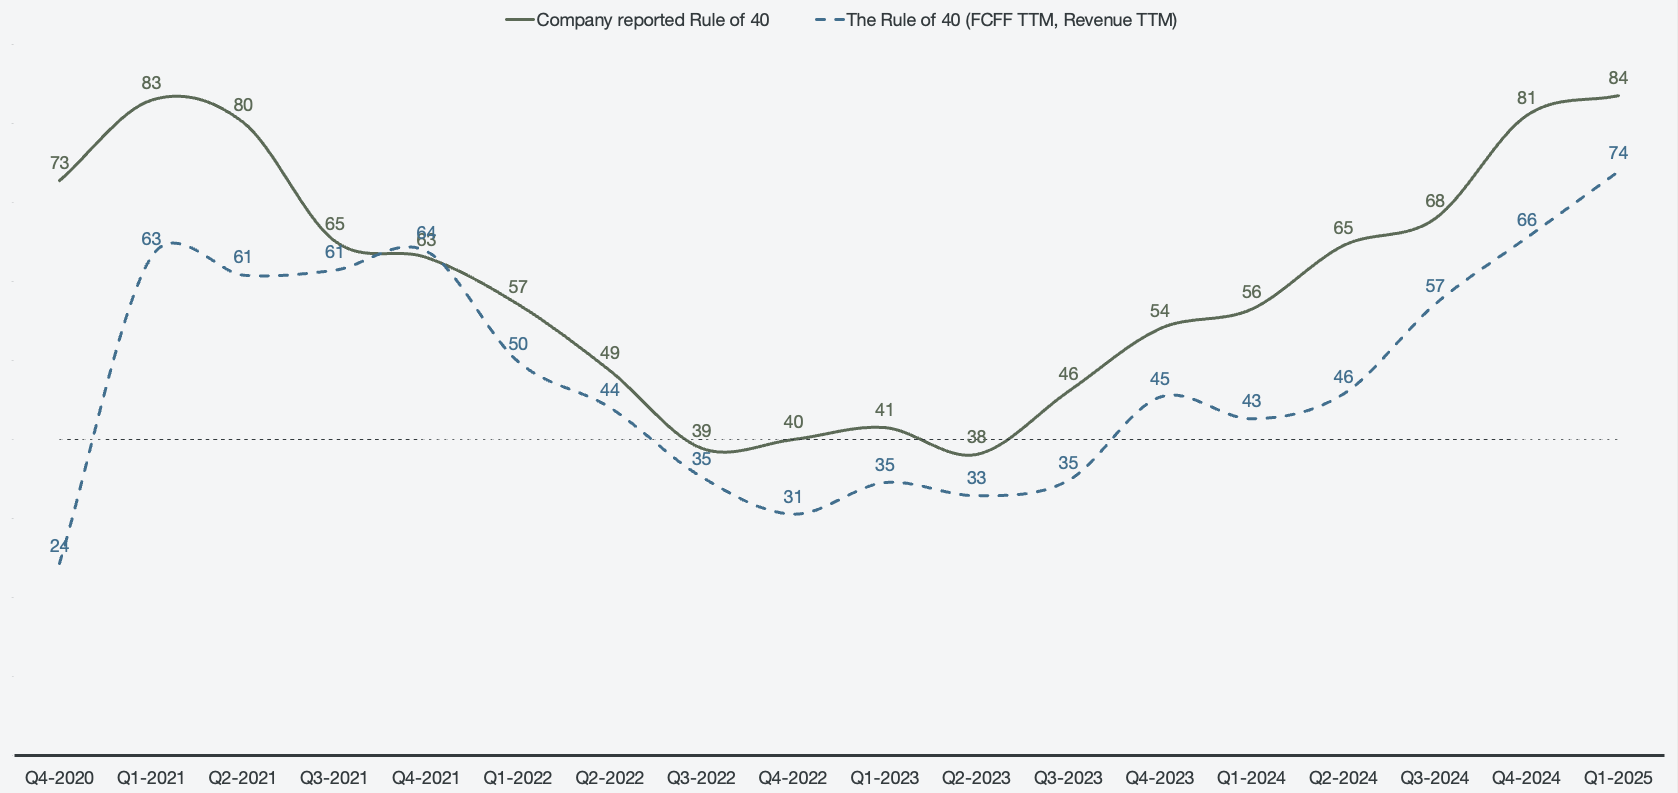
The rule of 40 is a common metric used to measure the quality of growth in SaaS companies. This metric combines the growth rate with the profitability margin to get a score, and reaching 40% or above is seen as high-quality growth. Typically, a company either focuses on growing revenues at the expense of profitability or increasing profitability at the expense of revenue growth. However, as it is not a GAAP metric, the growth and profitability metrics used are freely defined. Palantir reports the rule of 40 as such:
Year-over-year revenue growth.
Adjusted operating margins (adjusted for stock-based compensation expenses).
For Palantir, I like to define the rule of 40 over a trailing twelve-month period to smoothen out any inconsistent periods. I like to use cash generation as the measure of profitability for Palantir over operating margins, and due to the cash recognition of contracts being inconsistent, it makes sense to use TTM. I define the rule of 40 for Palantir as:
Year-over-year revenue growth on a TTM basis.
Free cash flow to the firm margins on a TTM basis.
In both measures of the rule of 40, there is a clear inflection point with the launch of AIP. A decreasing rule of 40 score, propped up by SPAC contracts, bottomed out in 2023 and has since then been increasing to an impressive score of 84 per Palantir’s definition and 74 per mine.
Being able to grow both profitability and revenue to this degree as a SaaS company is truly impressive and speaks to the high quality of Palantir as a company.
Figure 6: The rule of 40
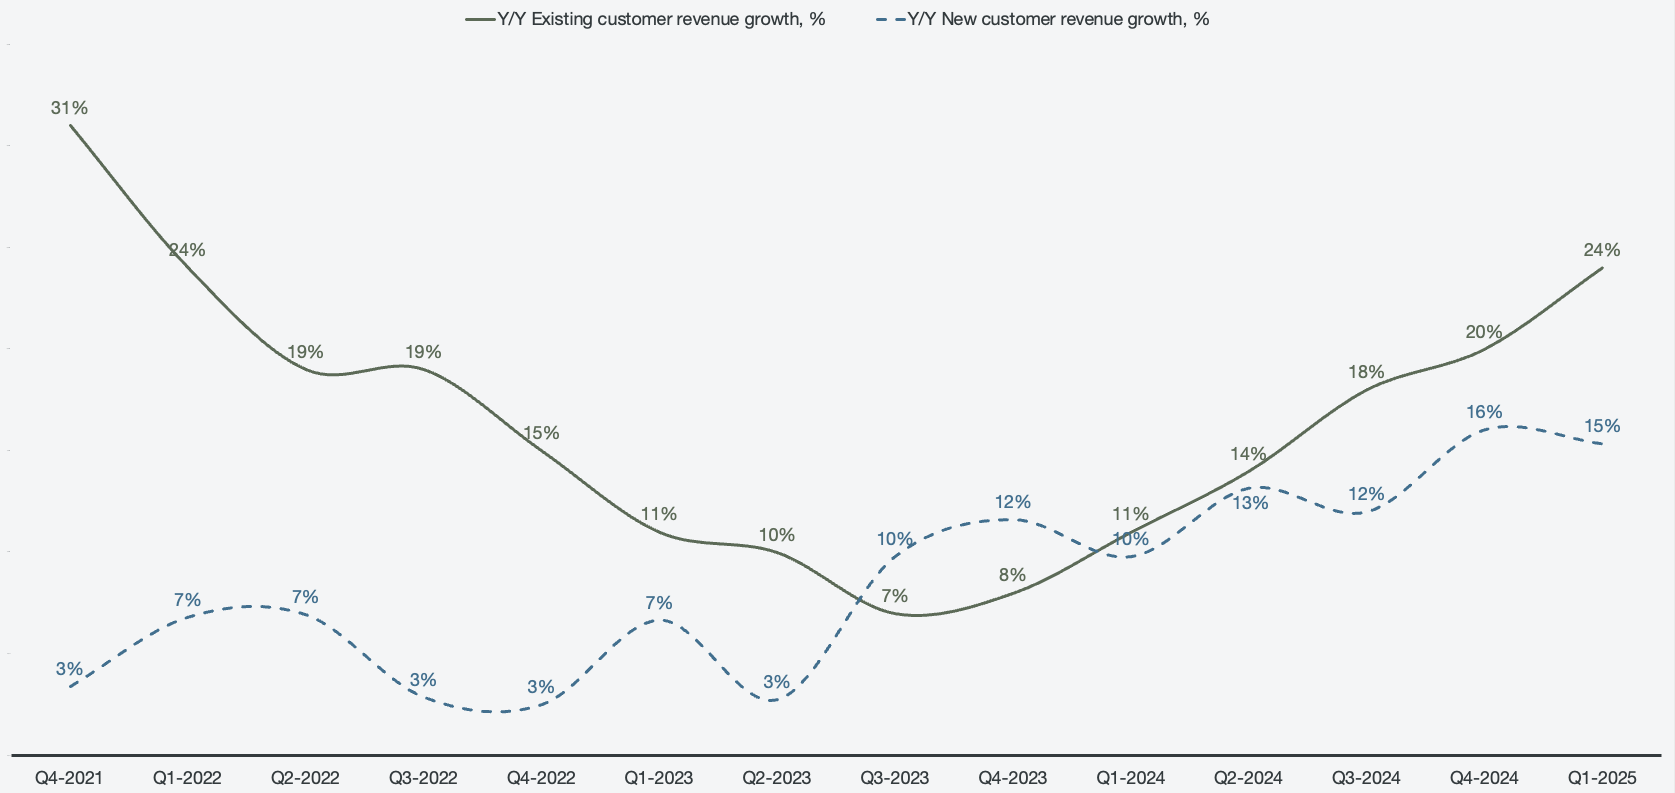
Per a UBS report from 18 December 2024, it is detailed that Palantir uses usage-based pricing for AIP. This means that if AIP is used for a single use case within an organization, the invoice from Palantir may not increase by a lot for the customer. However, if AIP is integrated throughout the whole business, or even powers it altogether, the invoice could double or triple compared to only using Palantir's Foundry product.
Since Q1 of 2024, existing clients have contributed a majority of the growth every quarter. This means that the customer base that has been with Palantir for more than 12 months increasingly spends more with Palantir, showcasing both stickiness and the value of the services and also the potential for scaling.
Figure 7: Cohort growth rates
Profitability is at its infancy
As an extension of the efficiencies introduced by bootcamps and AIP, Palantir’s profitability has been steadily increasing. Palantir had its first quarter of profitability in Q4 of 2022 on a net basis but became operationally profitable the subsequent quarter. With every passing quarter since, with an exception of Q4 of 2024 due to a SARs expense, Palantir’s operating margins have been increasing.The operating margins are consistently improving due to the efficiency of the employees at Palantir. While revenue growth has been aggressive, the costs associated with operations have paced far slower, resulting in an ever-increasing operating margin.
Figure 8: Profitability margins
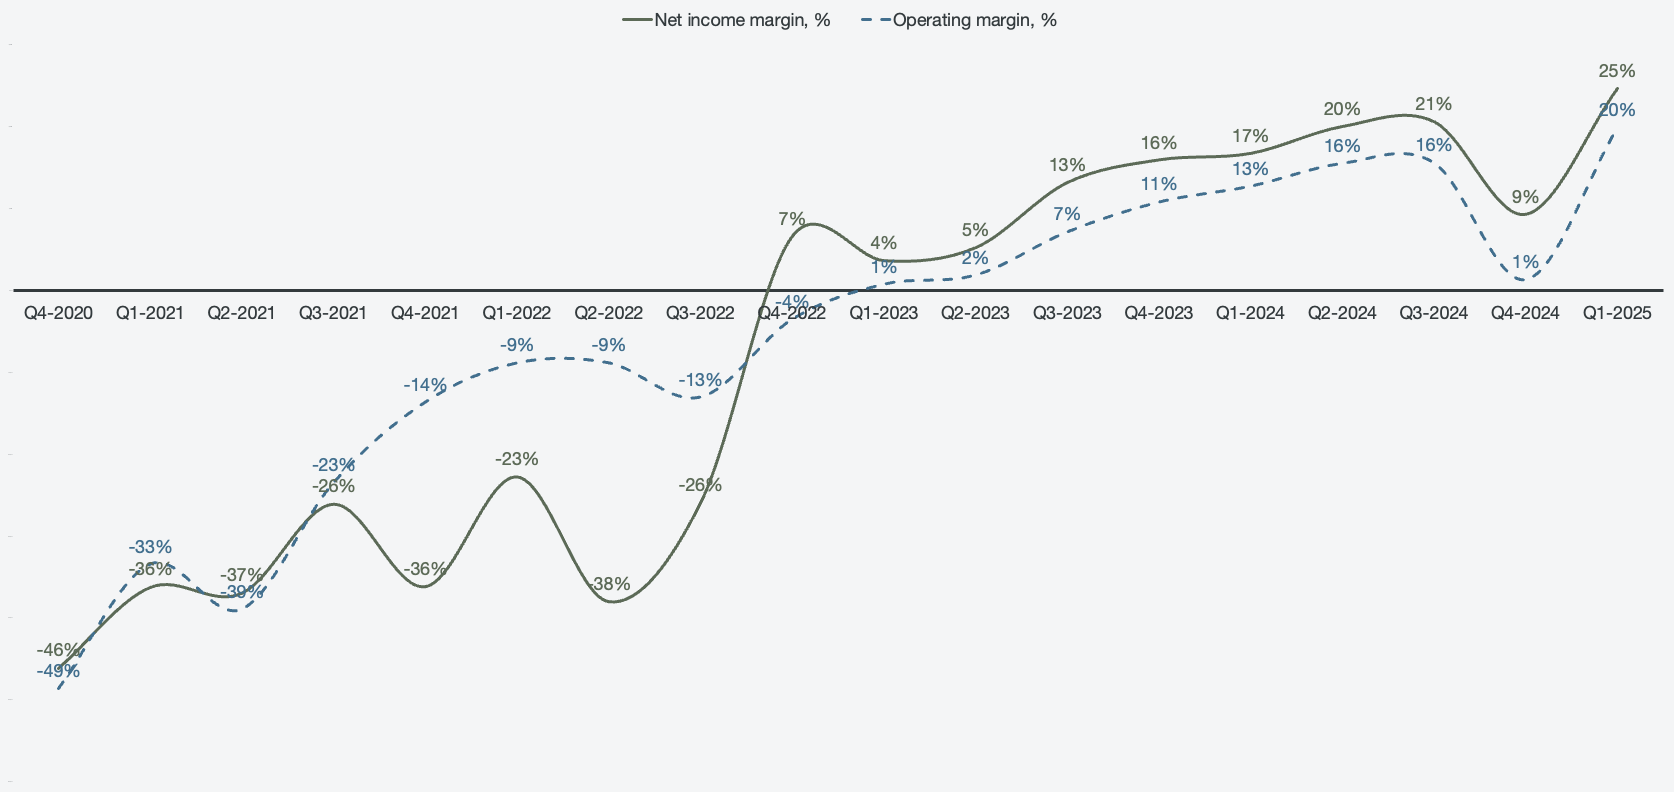
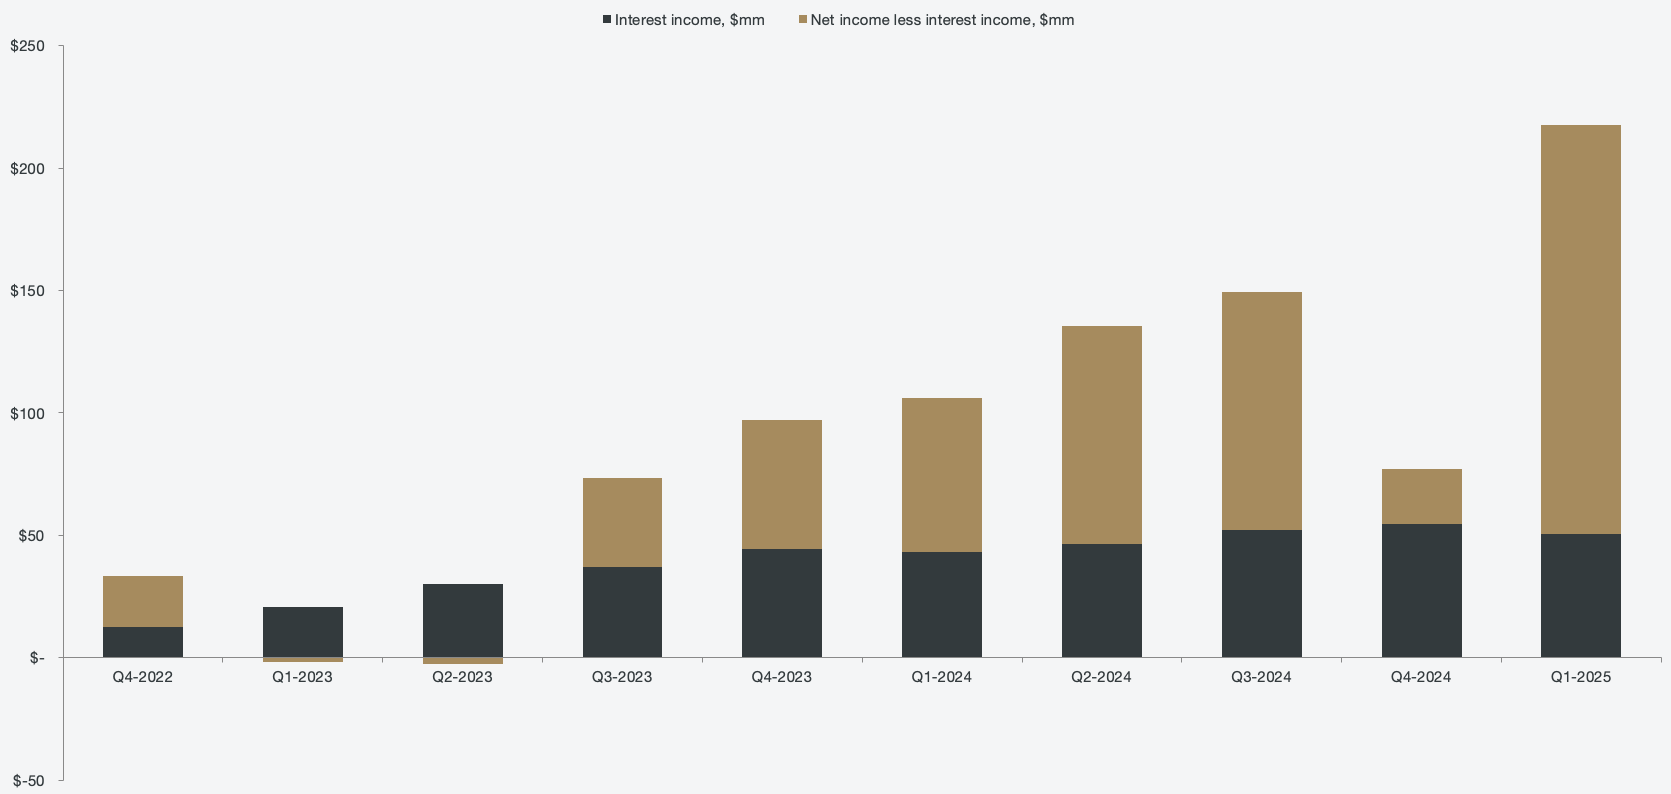
There is an interesting dynamic between net and operating margins due to a large amount of interest income. Palantir has taken advantage of the currently high interest environment and invested in interest-bearing instruments, such as treasury bills. This is a smart use of cash, assuming that the business is not capital constrained to further increase growth. However, it will not last forever, which is why there is a great deal of importance in consistently improving operating margins.
Figure 9: Interest income contribution
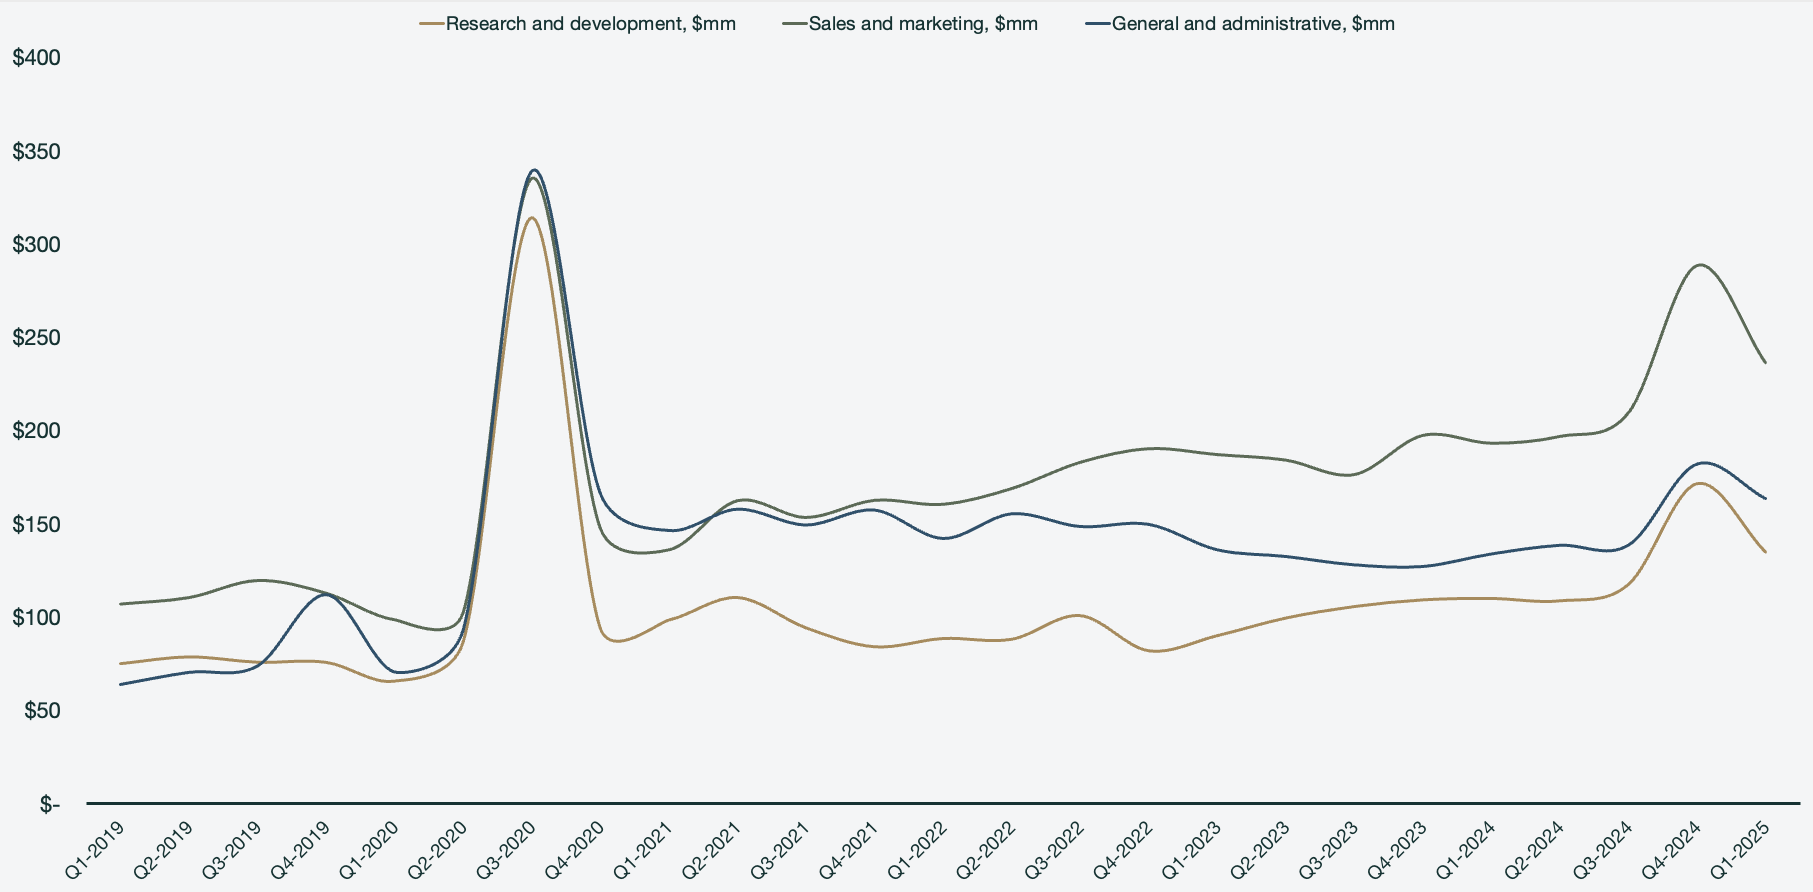
The operating margins are consistently improving due to the efficiency of the employees at Palantir. While revenue growth has been aggressive, the costs associated with operations has paced far slower, resulting in an ever increasing operating margin.
Figure 10: Operational expenses
This is further highlighted by looking at revenue per employee. Palantir is said to have the best talent in the industry, which should and does translate to the strongest revenue per employee metric within the SaaS space. ¹
Figure 11: Employee efficiency
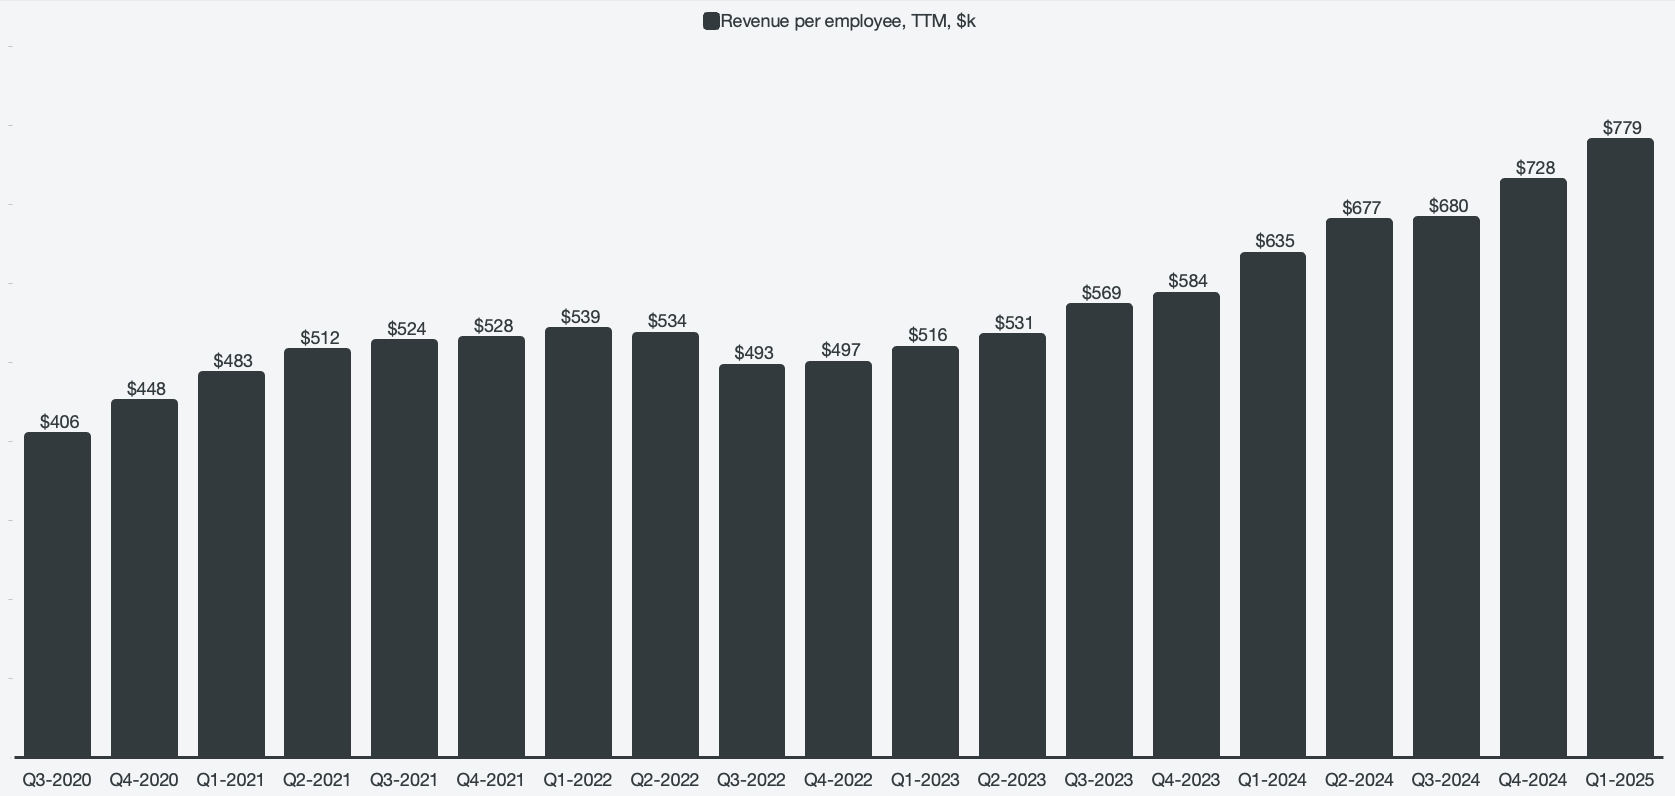
¹ Based on Q1 2025 data, measured against C3.AI, CrowdStrike, Cloudflare, DataDog, ServiceNow, Snowflake, Salesforce, Palo Alto Networks, The Trade Desk, and Adobe.
The question then becomes, is Palantir overpaying for the talent? Investors are increasingly wary of high dilution rates in terms of stock-based compensation.
A common way to compare dilution rates is stock-based compensation as a percentage of revenues. In this regard, Palantir is consistently decreasing its rate of dilution. Palantir’s dilution rate may seem excessive at first glance, but it is around average compared to the SaaS industry. ²
Figure 12: Rate of dilution through stock-based compensation
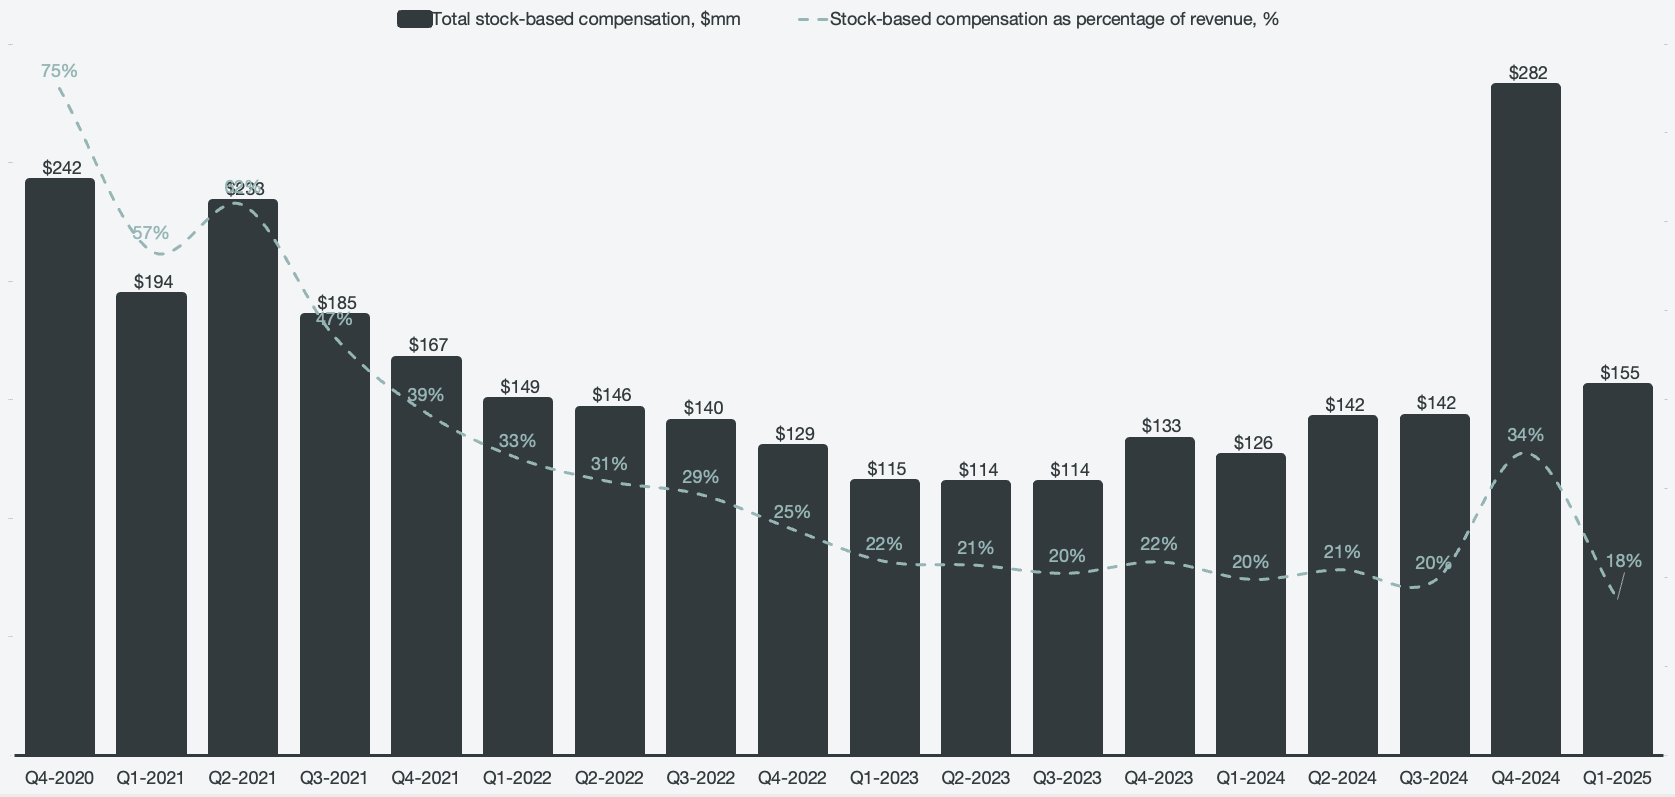
² Based on Q1 2025 TTM data, measured against C3.AI, CrowdStrike, Cloudflare, DataDog, ServiceNow, Snowflake, Salesforce, Palo Alto Networks, The Trade Desk, and Adobe.
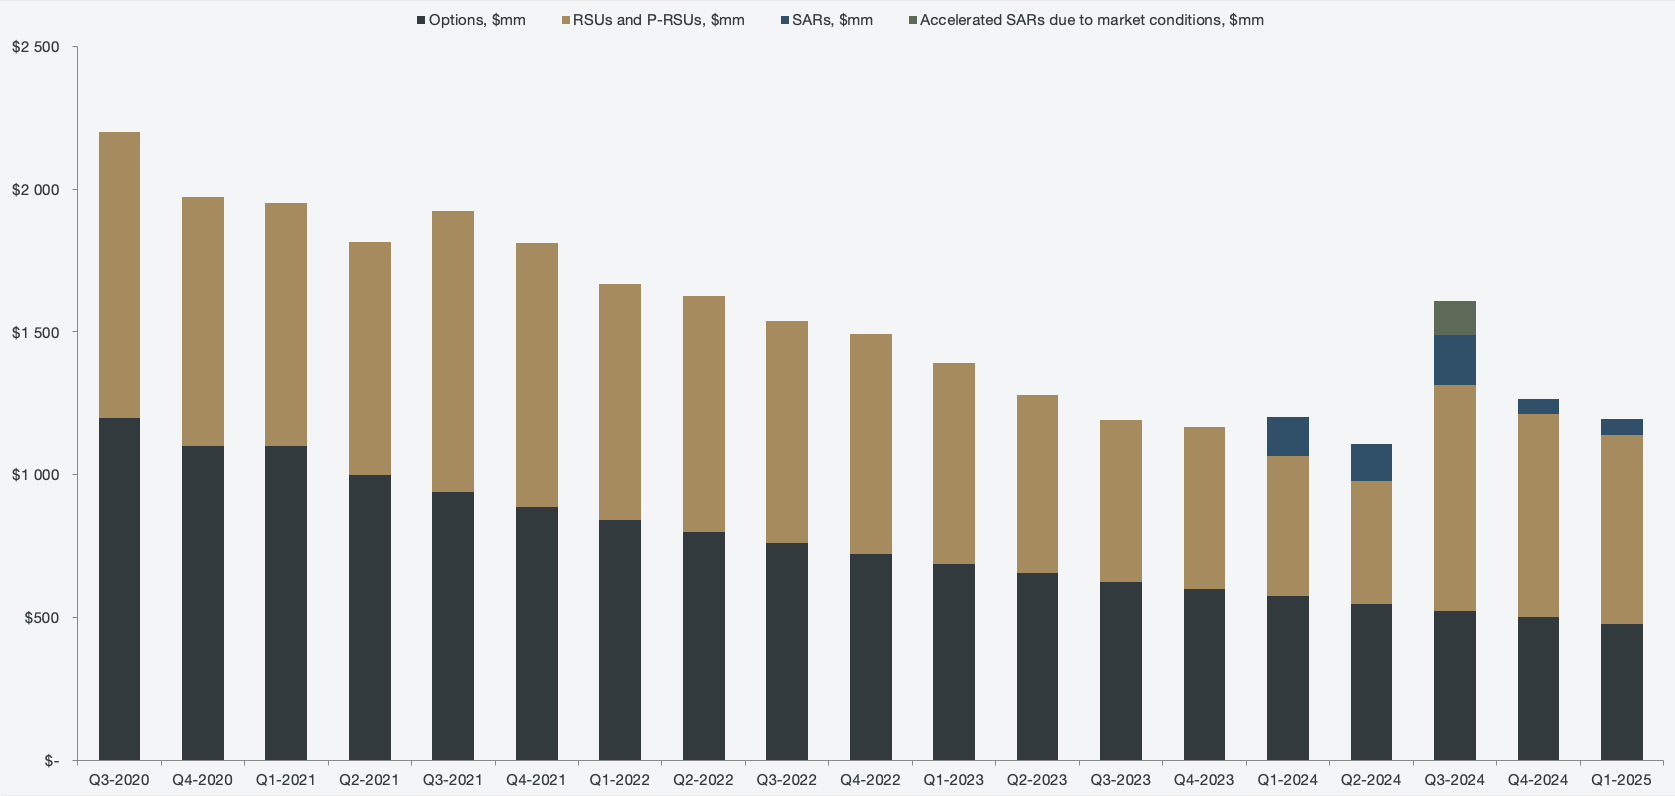
I expect the dilution rate to consistently decrease as Palantir continues to grow at a faster pace than the rate of dilution. Looking at the options expense balance, there is a clear downtrend and larger focus on performance-based compensation.
Figure 13: Outstanding expense balances
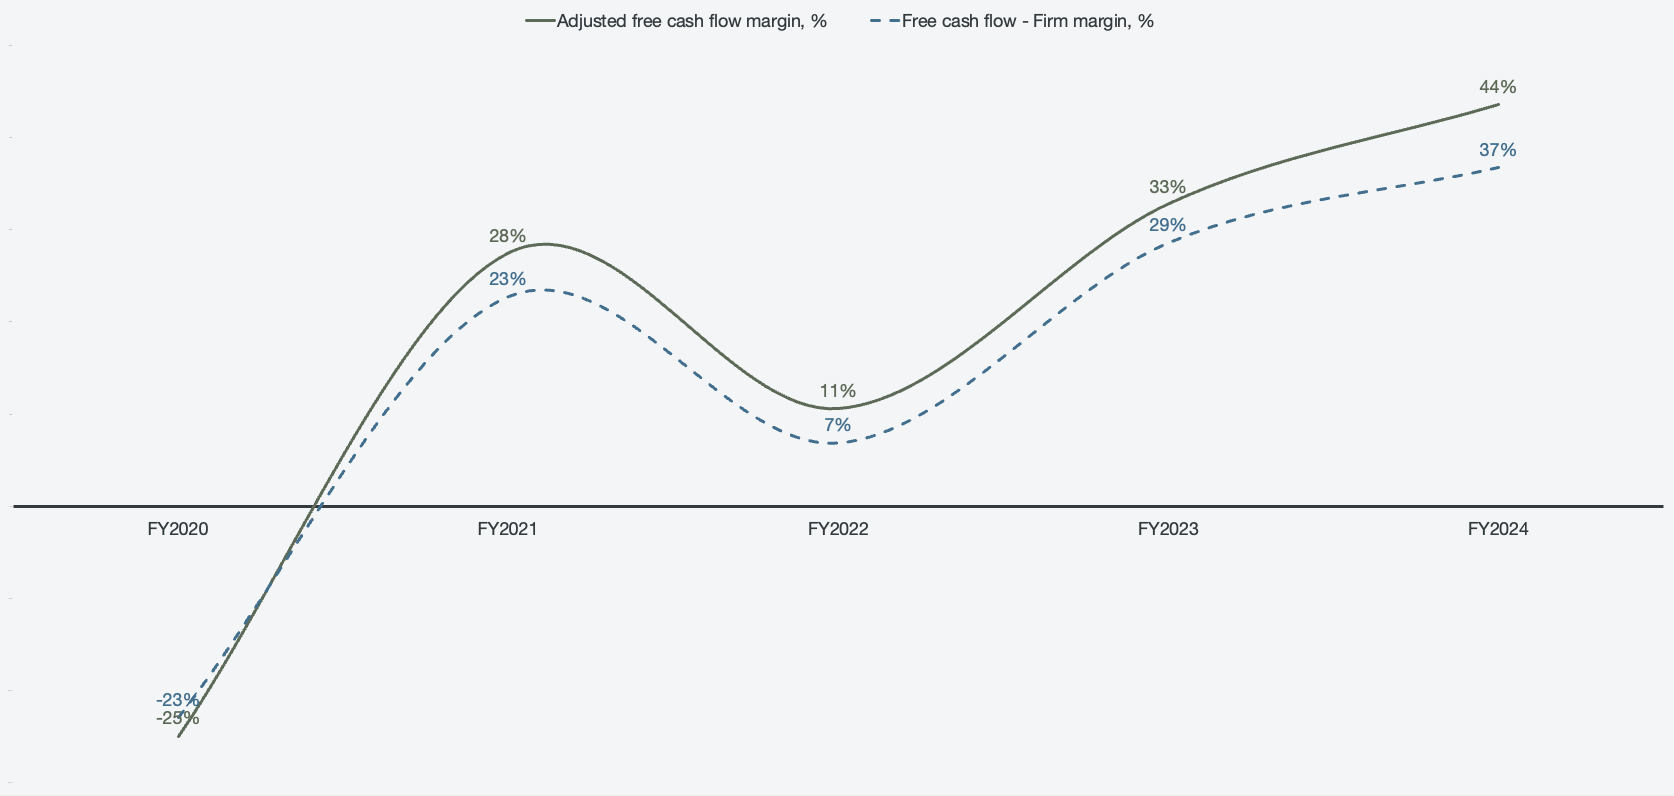
While only turned operationally profitable in 2023, it has been generating cash since 2020. On a fiscal-year basis, Palantir has been cash flow positive since 2021, which has resulted in the company increasing its cash and short-term investments pile for 4 years in a row. In addition, Palantir has been debt-free since Q2 of 2021.
Figure 14: Free cash flow margins
Given Palantir’s highly efficient sales, its employee efficiencies, and the sheer scalability potential with AIP, I currently see no ceiling to the margin increase potential.
Growth has only just begun
It is easy as an investor to stare oneself blind at the rapid increase in the quote and feel like you have missed out. However, it is vital to understand how early Palantir is in its journey. As a reference, Palantir currently has a total of 769 customers. In comparison, Salesforce is approaching 200,000 customers.
Figure 15: Total customer growth
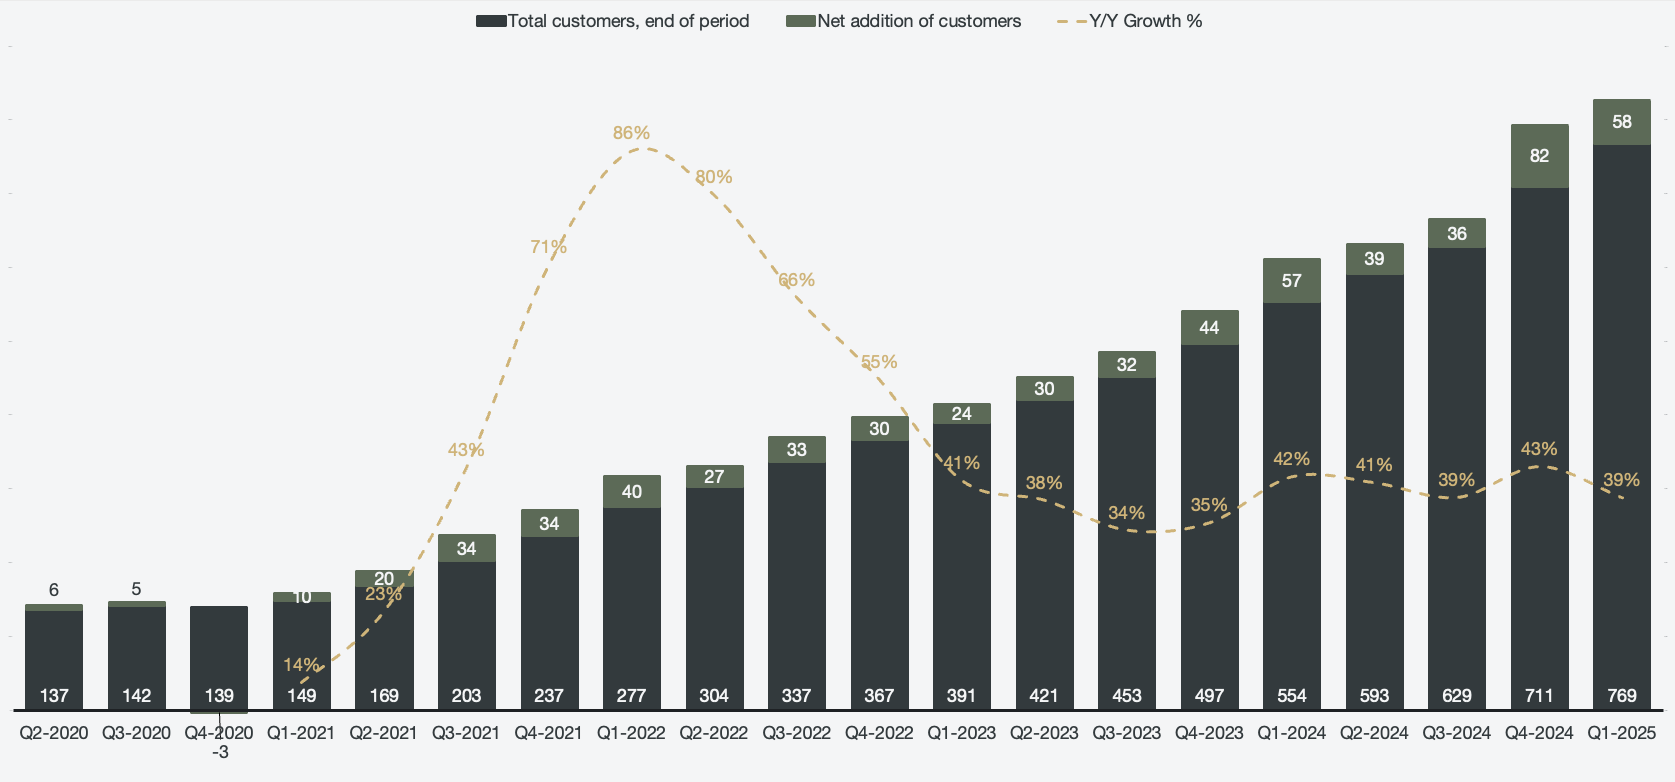
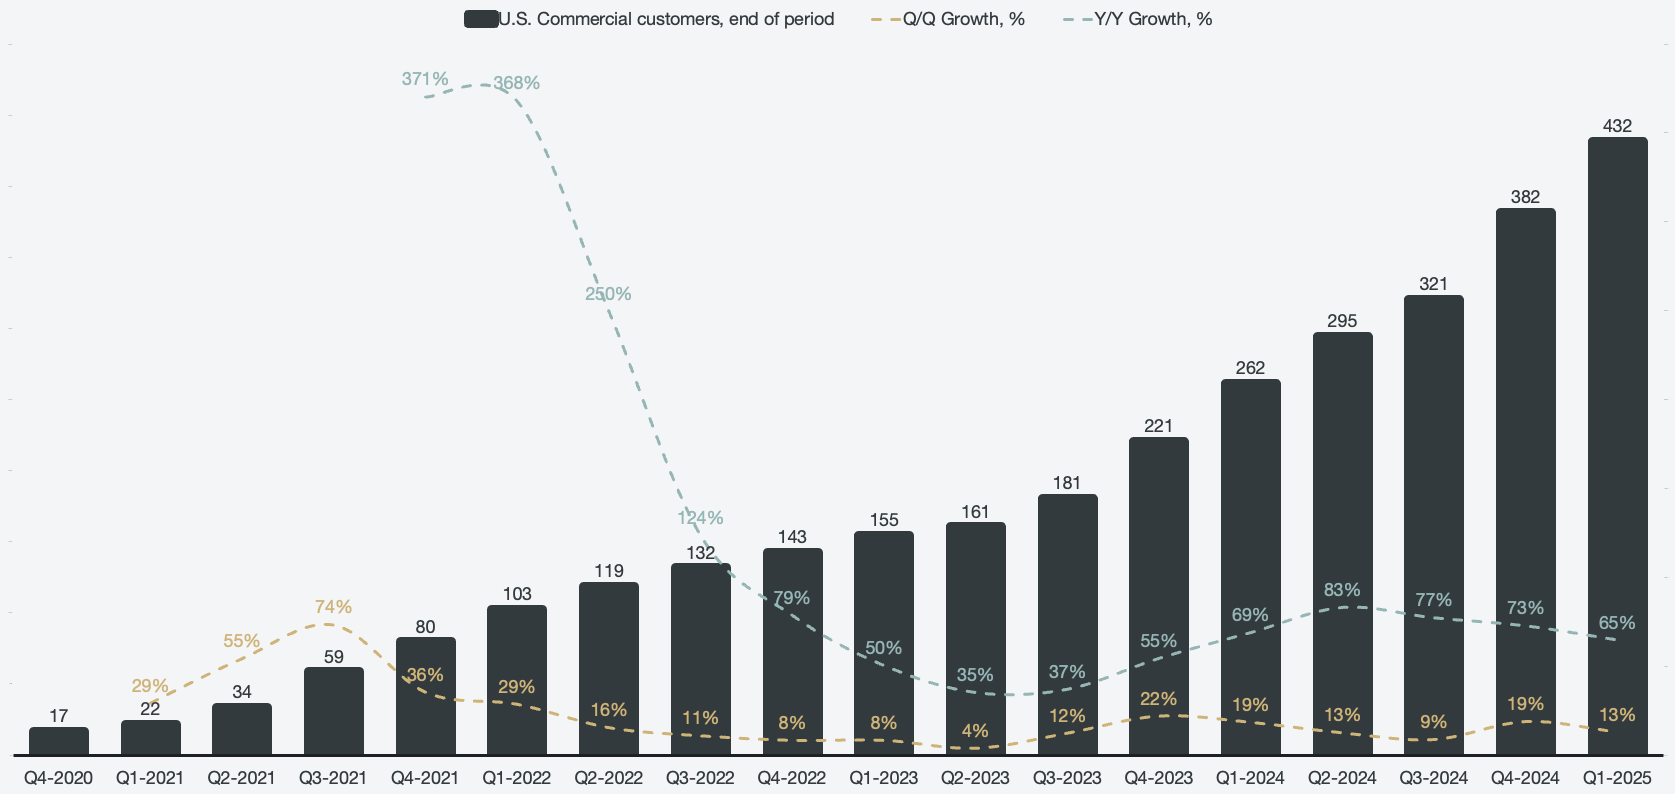
As seen from the cohort data, a majority of Palantir’s revenue growth is credited to existing customers rather than new ones. The scalability of existing customers is really powerful for Palantir, which is why it is crucial to grow the customer base, as these will fuel future revenue growth. Similarly to most data charts relating to Palantir, there is an acceleration in relation to the launch of AIP in 2023. As mentioned earlier, the U.S. commercial segment is the biggest beneficiary of AIP so far, as the efforts have been concentrated in that segment. However, despite aggressive growth in customer counts, Palantir still only boasts 432 U.S. commercial clients, meaning there is exponential opportunity within the segment for growth.
Figure 16: U.S. commercial customer growth
The current revenue growth rates are mainly supported by the U.S. market, but with geopolitical conflicts on the rise as well as stagnant European markets, Palantir stands to benefit globally. NATO countries are increasing their defense budgets, which I expect will have a focus on AI solutions similarly to the DoD. In addition, the overregulated European market is being left so far behind on the global stage that it will have to adapt and adopt AI solutions.
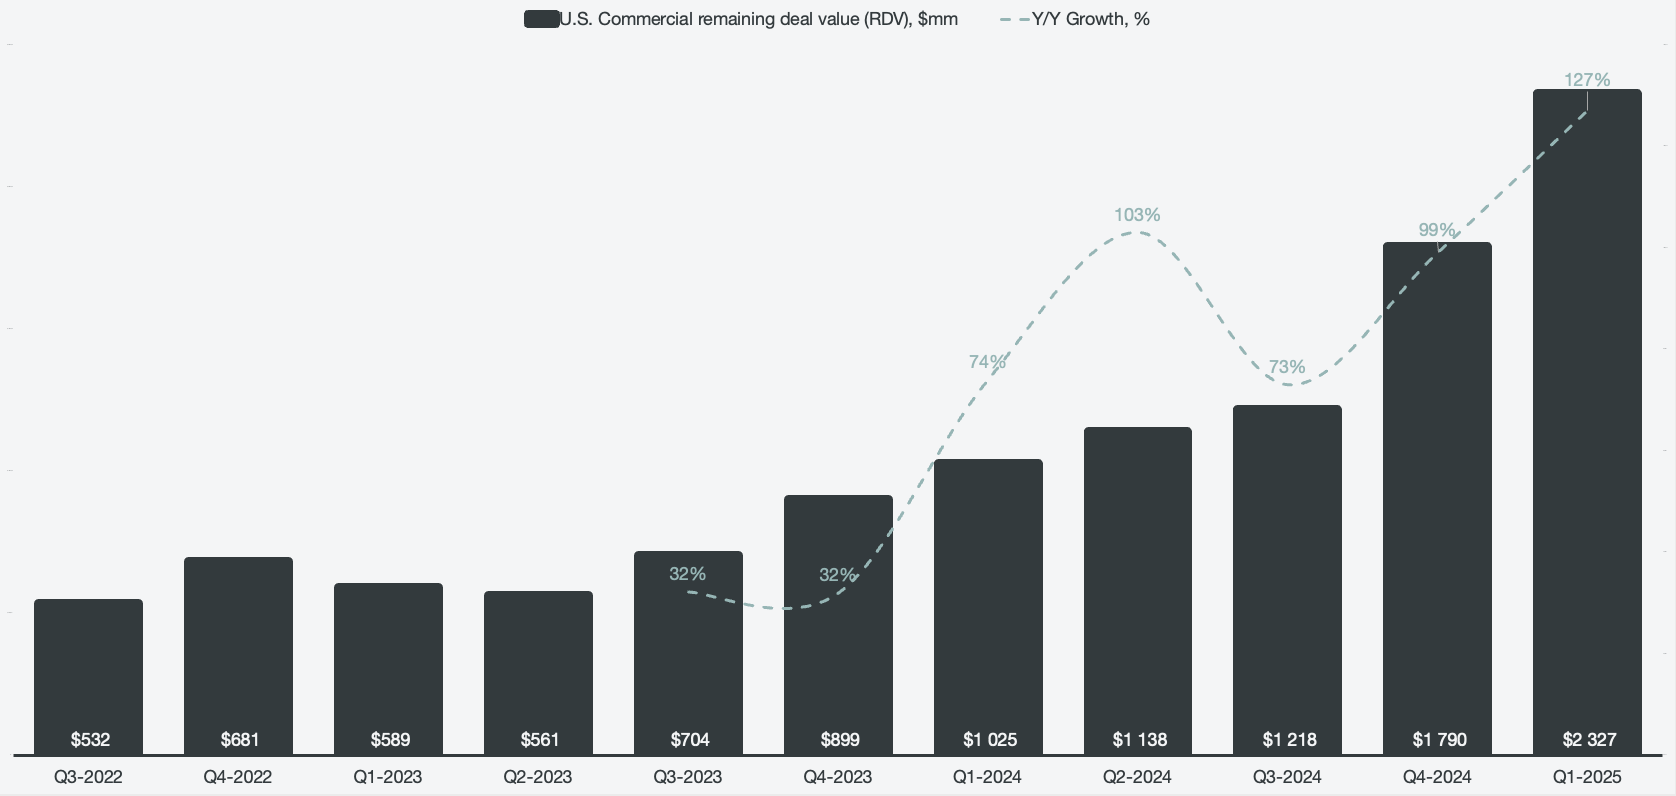
Looking at various contract balances, they are all pointing towards an increase in growth, with no signs of slowing down. Remaining deal value outlines outstanding revenue not yet collected; however, the full amount is not guaranteed as it includes options in the contracts that may not be fulfilled. In the U.S. commercial space, remaining deal value has grown at or above 100% for 3 out of the last 4 quarters.
Figure 17: U.S. commercial remaining deal value balance
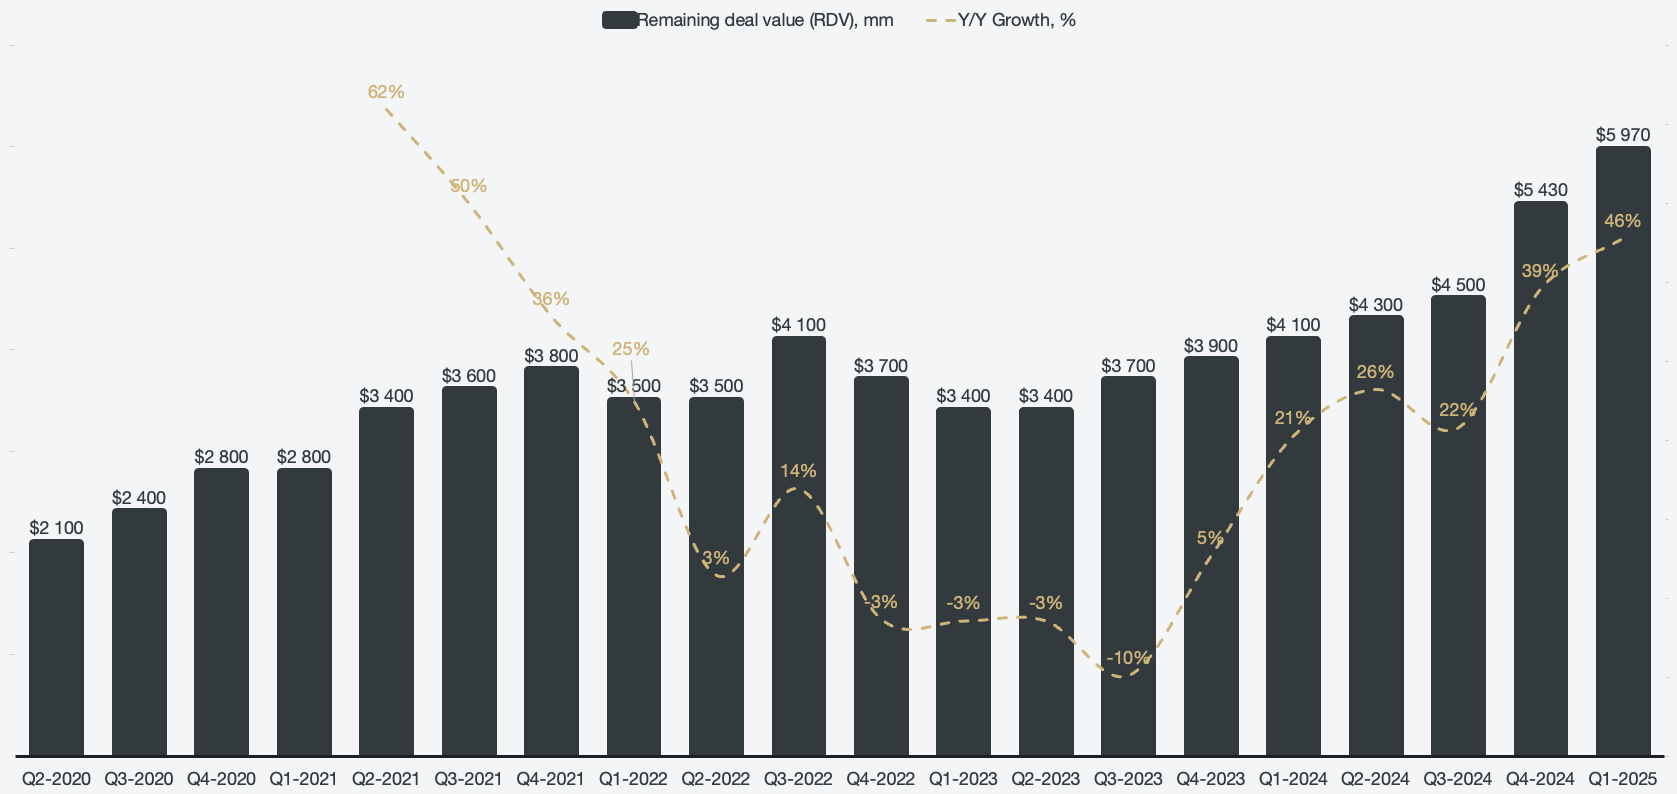
The remaining deal value, including all segments, currently stands at ~$6 billion while accelerating its upward trend.
Figure 18: Remaining deal value
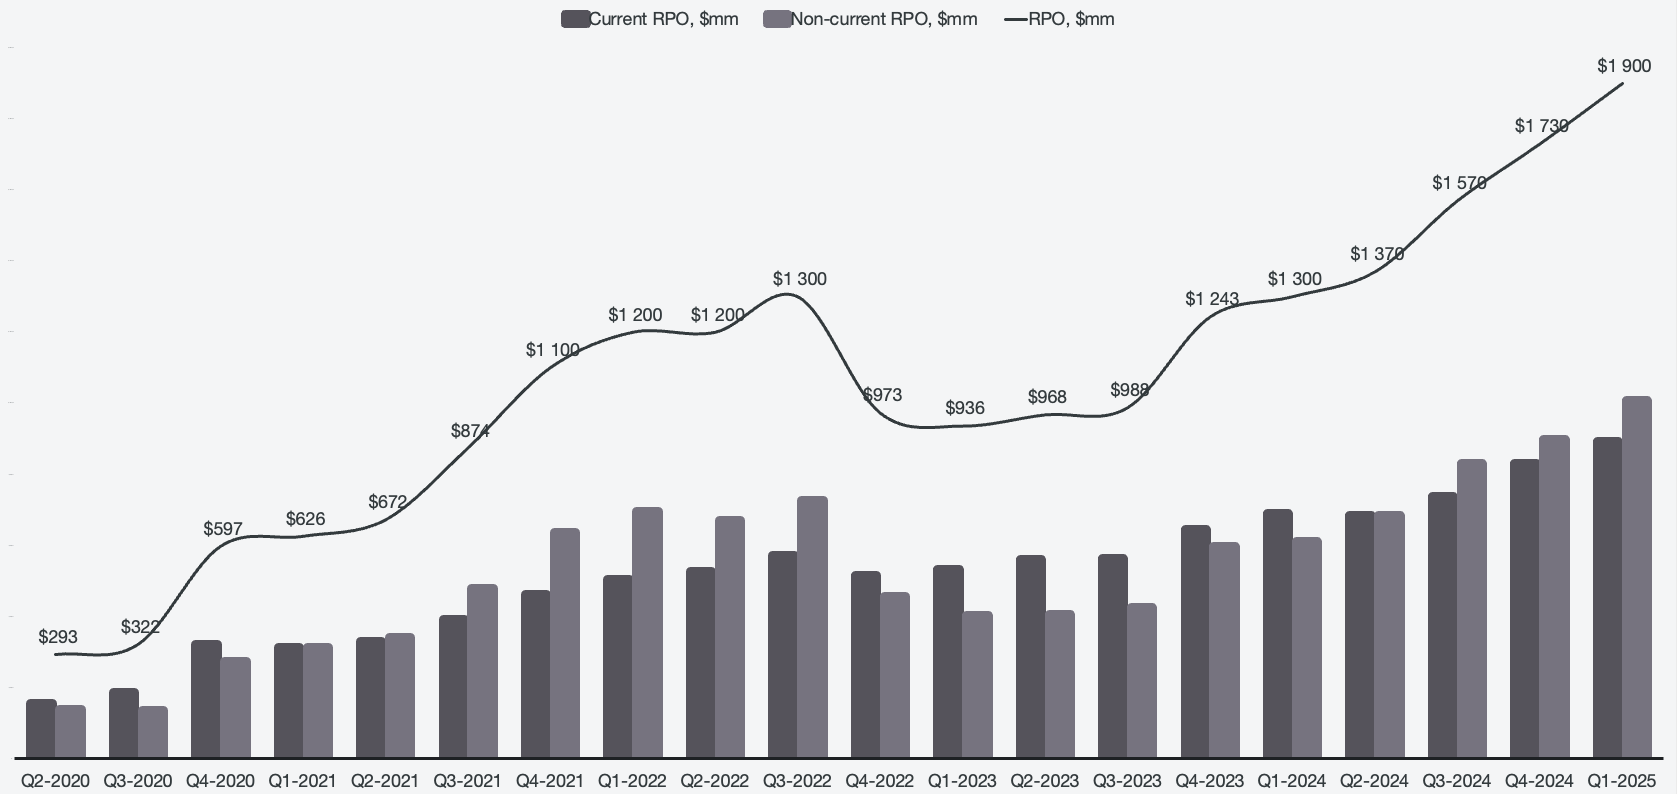
While remaining deal value balances are not completely guaranteed, remaining performance obligations are guaranteed. However, RPO is primarily used as a proxy for the commercial segment of the business, as many government deal structures include uncertainties in terms of length and size. RPO has increased for the past 6 quarters, now standing at $1.9 billion, with most of it being non-current, meaning there is a lot of revenue far out into the future that is guaranteed.
Figure 19: Remaining performance obligations
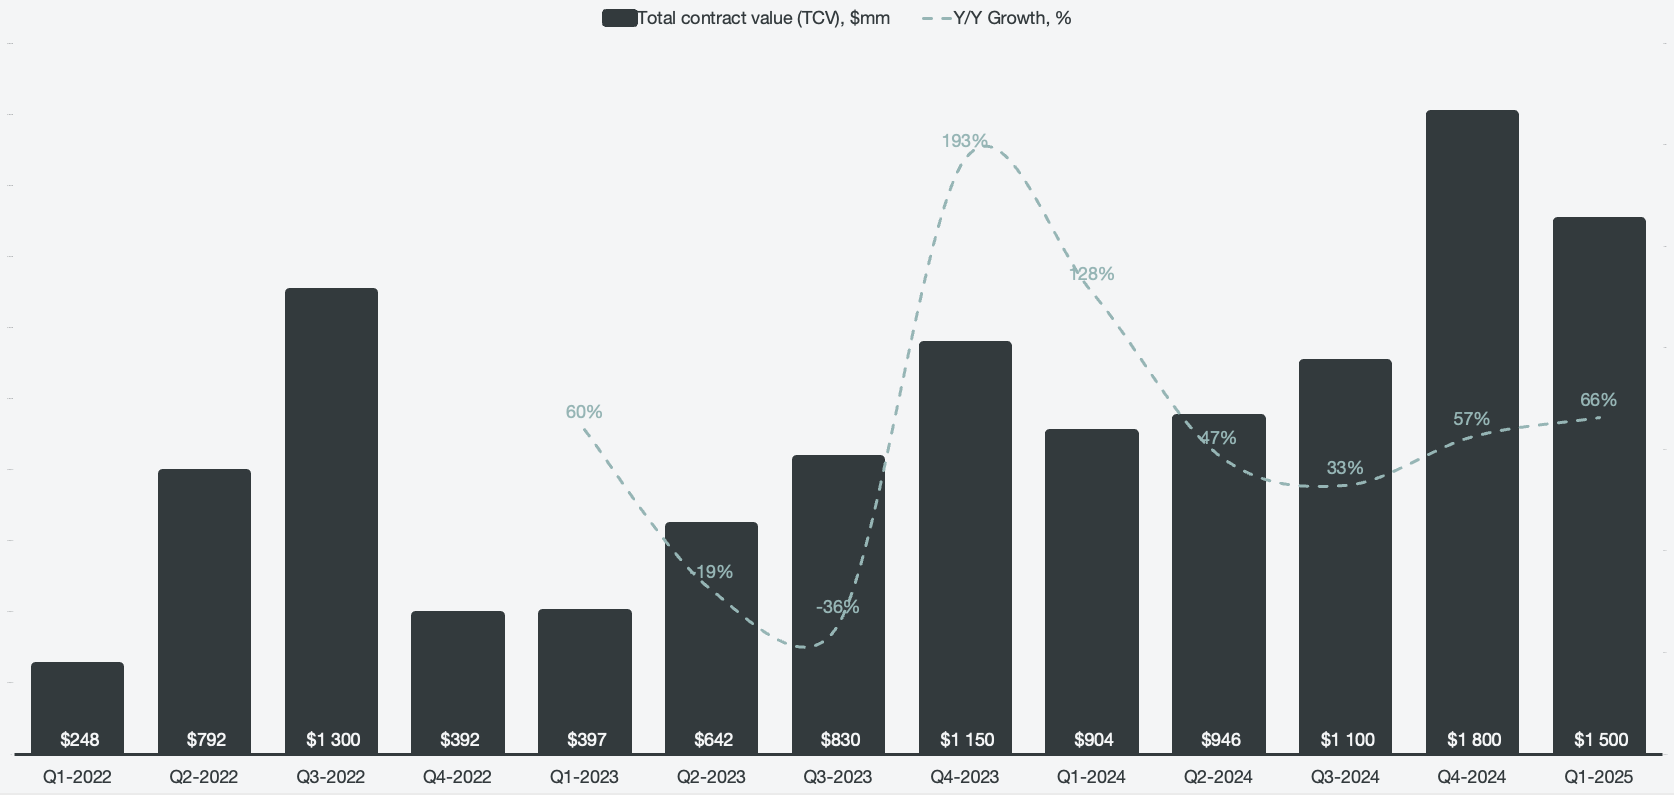
Looking at total contract value per period, we can see that there is an overall positive trend as well. It is to be noted that the latter half of fiscal year periods sees more contracts signed historically compared to the first half, which results in the quarterly chart looking choppy. On a fiscal-year basis, TCV grew 57% year-over-year in 2024.
Figure 19: Total contract value
The exact composition of the total contract value per period is not provided, but we do receive a breakdown of deals of at least $1 million. Historically, Palantir’s suite of products was not modularized and quite expensive; it was not an attractive proposition for a small company to pay for an extensive product while only trying to solve a small use case. However, with the launch of AIP and usage-based pricing, we can see a clear increase in the amounts of signed deals between $1 and $5 million.
Figure 20: Deal breakdown
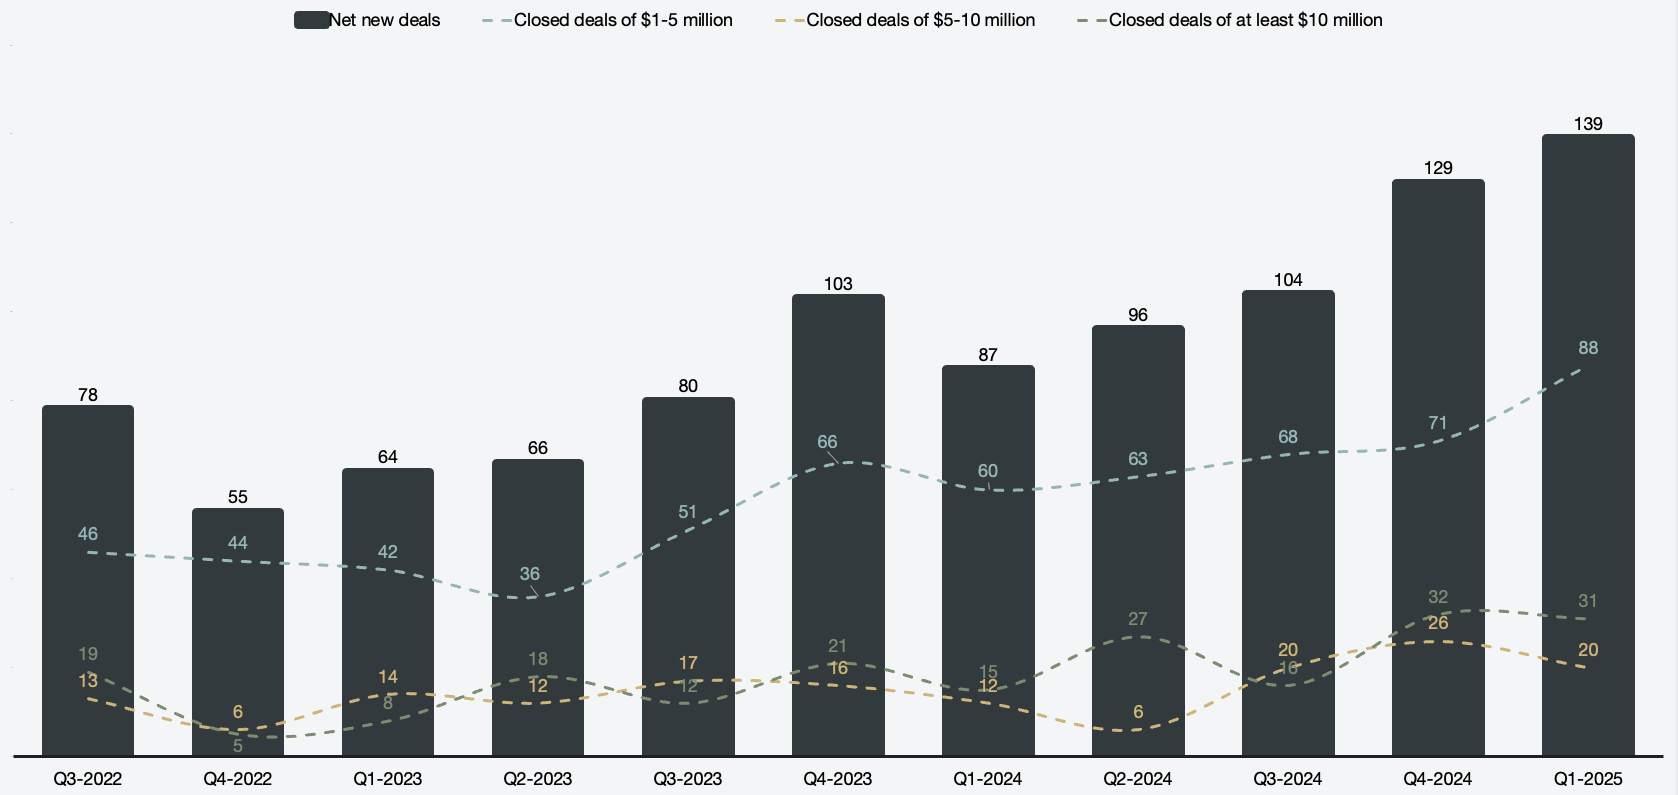
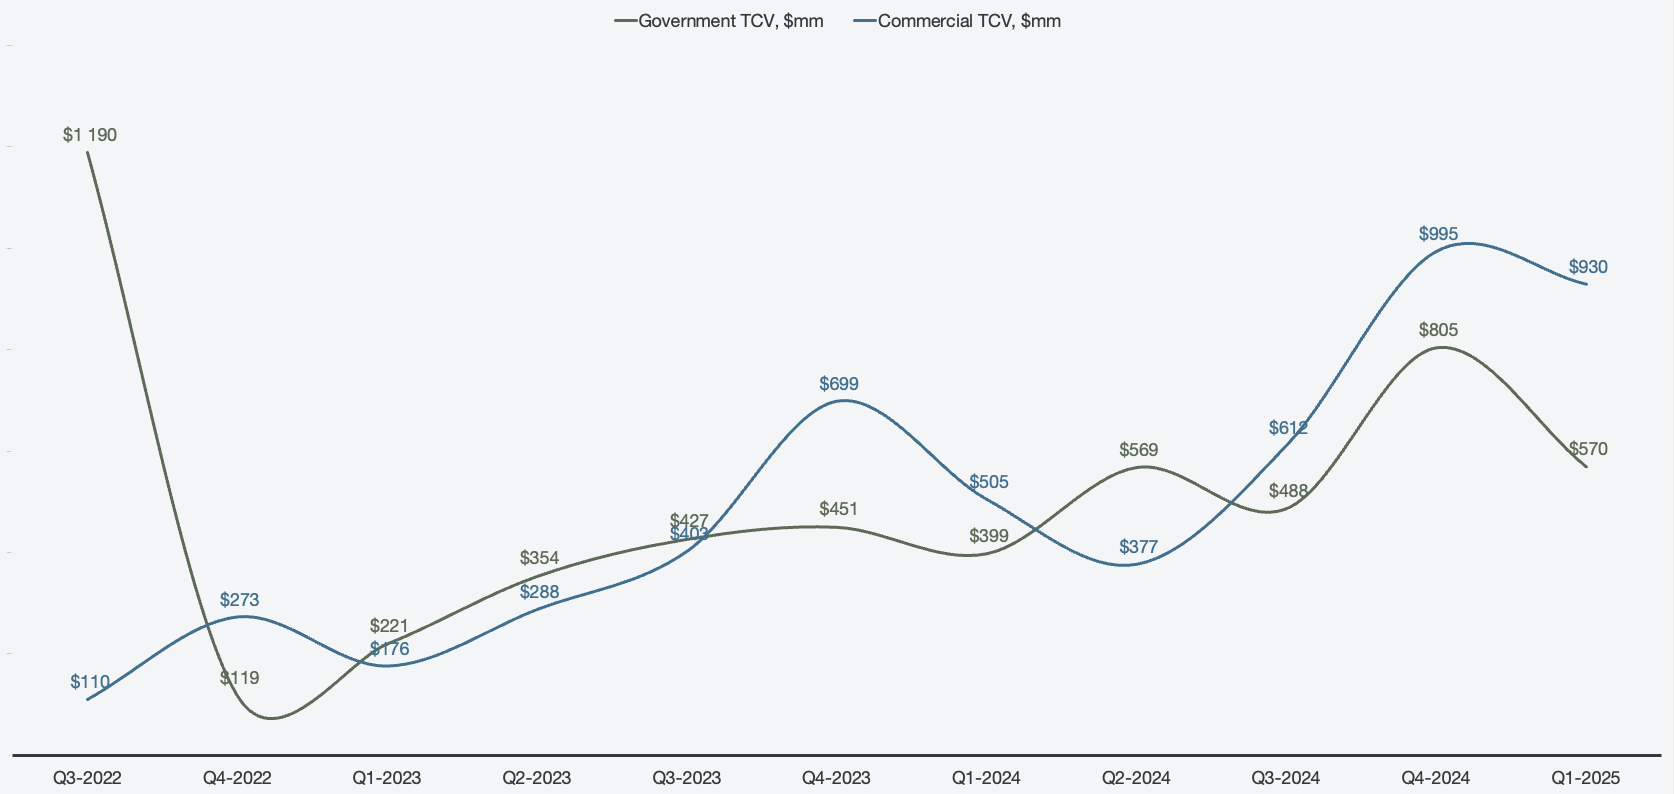
A segmented breakdown of total contract value is provided, where the commercial segment has accounted for a majority of TCV for most recordable periods.
Figure 21: Segmented total contract value
While overall revenue growth is reaching very impressive levels, there are no data points suggesting that it is about to decrease anytime soon. The opportunities ahead are plentiful for Palantir to capitalize on, and as the best positioned company to do so, I believe investors are about to see increasingly more impressive numbers.
Risks have been minimized in recent periods
Most of the larger risks associated with Palantir have been resolved, the primary one being finding a scalable solution suitable for businesses of all sizes, as well as an efficient go-to-market strategy. AIP resolved both of these issues in one fell swoop, but not all numbers are rosy.
The international commercial revenue segment has been stagnant since the company went public. In a large majority of the earnings calls since going public, the company has frequently referenced poor European sales. The region has been a drag on otherwise expanding markets, primarily in Asia, where Japan and South Korea are favoring Palantir products.
Figure 22: International commercial revenue
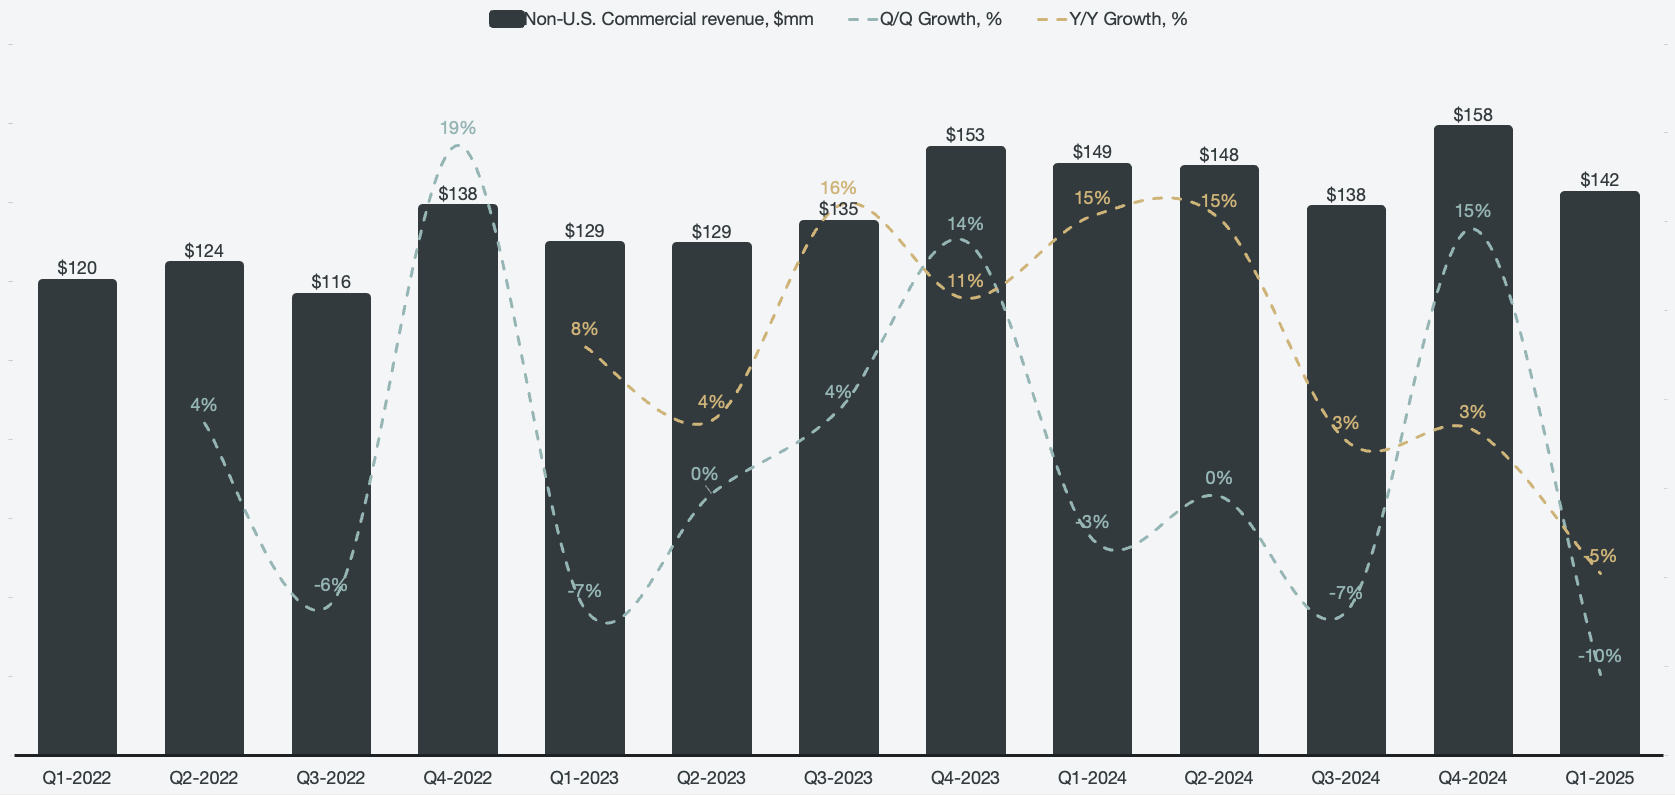
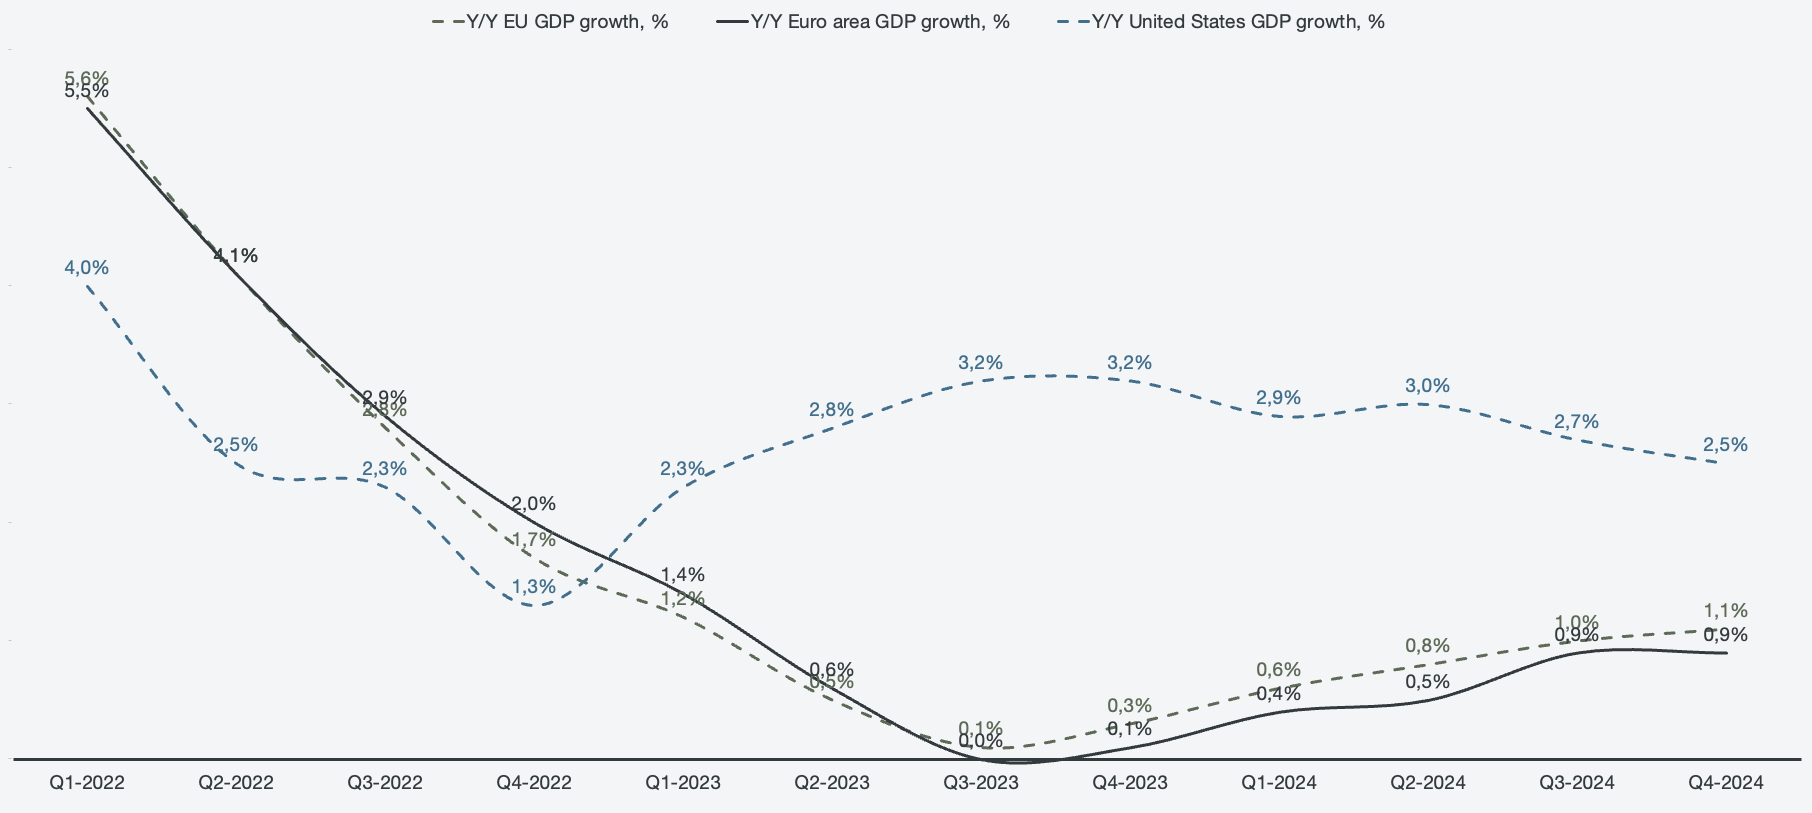
This is, in large part, unsustainable for the EU and the Euro Area, which have been regarded as overregulated and anti-business as a whole. This is evident in the GDP growth post-Covid, where the U.S. has surged while the EU and the Euro Area have been unable to keep up.
Figure 23: GDP growth in the west
It remains unknown what the future of Europe looks like, but Palantir has to be ready to capitalize once an opportunity presents itself in the area. They have already been signing some major contracts in the area as of Q2 2025, which should lend to a meaningful increase in revenue growth internationally.
Another risk factor is Palantir’s media portrayal. Major publications have been critical of Palantir’s work with the government, which has been controversial since Palantir’s inception. Palantir has fought back publicly on X against a specific piece in The New York Times, showing evidence of false and misleading information in the news article. For those informed on business and its products, the claims made in the article were easily dismissed, but for the grander populace, that might not be the case.
Intrinsic valuation and fair value
Palantir is an interesting business to analyze because it presents so many challenges when it comes to intrinsic valuation. In terms of pricing, it's one of the most expensive software companies in the S&P 500, trading at 126 price-to-sales and 678 price-to-earnings. However, value is different from pricing, and Palantir’s fair value has a wide range depending on its ability to capture future market share.
Table 1: Intrinsic valuation model
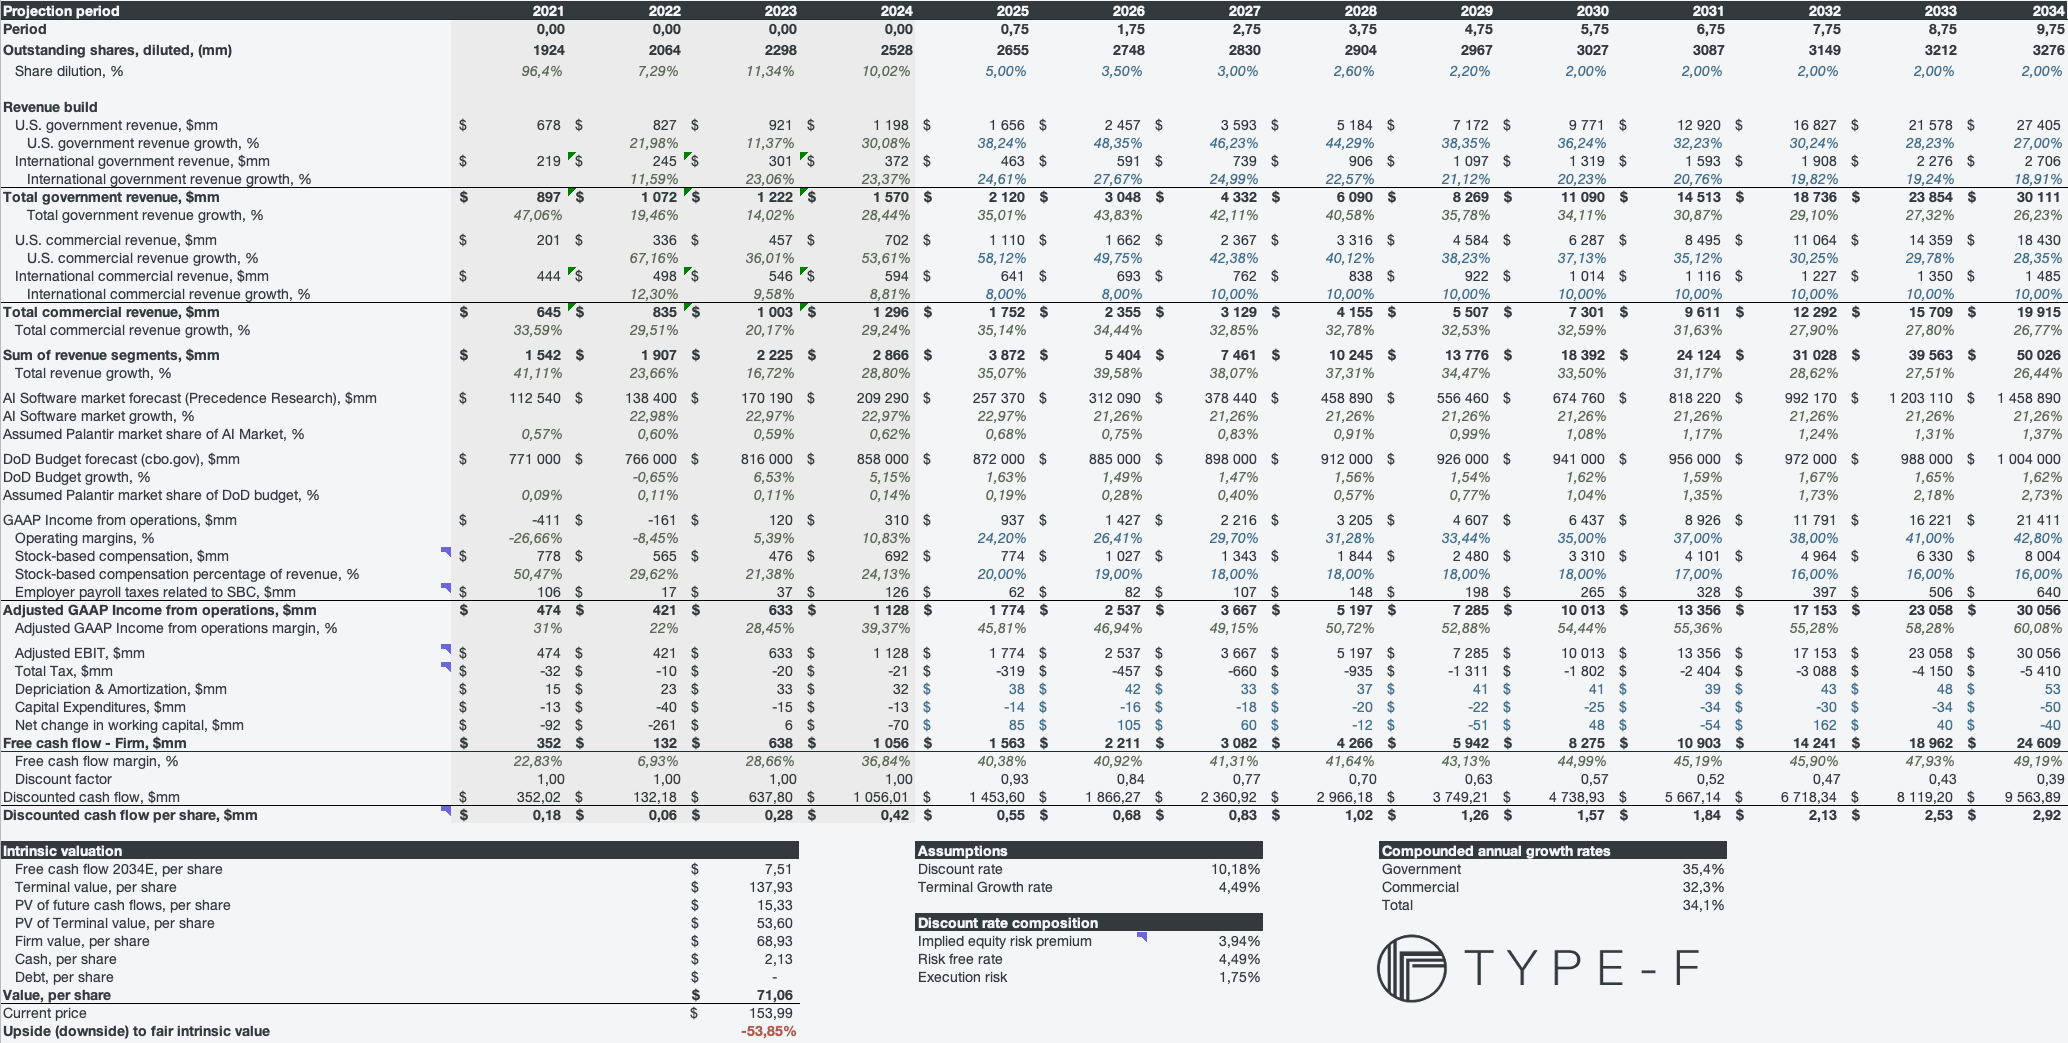
My base valuation model sees accelerated growth within the U.S. government for the remainder of the decade before trailing off, while international government revenue increases in the coming years, but at a much slower pace compared to the U.S. government. In total, I forecast the government revenue to compound annually at 35.4%, while the commercial business grows at 32.3% CAGR, with international commercial revenue being a major drag.
I have free cash flow to the firm margins increasing from 36.84% in 2024 to 49.19%. This is a bit conservative on my end, because reinvestment needs are especially low for Palantir, while operating margin expansion has a probable chance to meaningfully increase past 40% given Palantir’s efficiencies. This combines for a fair intrinsic value estimate of $71.06 per share, which indicates -53.85% to fair intrinsic value.
However, excluding company-specific risk does not appear to give Palantir an extreme premium in the way the pricing metrics indicate. Assuming a 35% CAGR over the forecasting period, along with 60% free cash flow to the firm margins, the company is trading fairly valued at its recent new all-time high.
Table 2: Market implied intrinsic valuation model
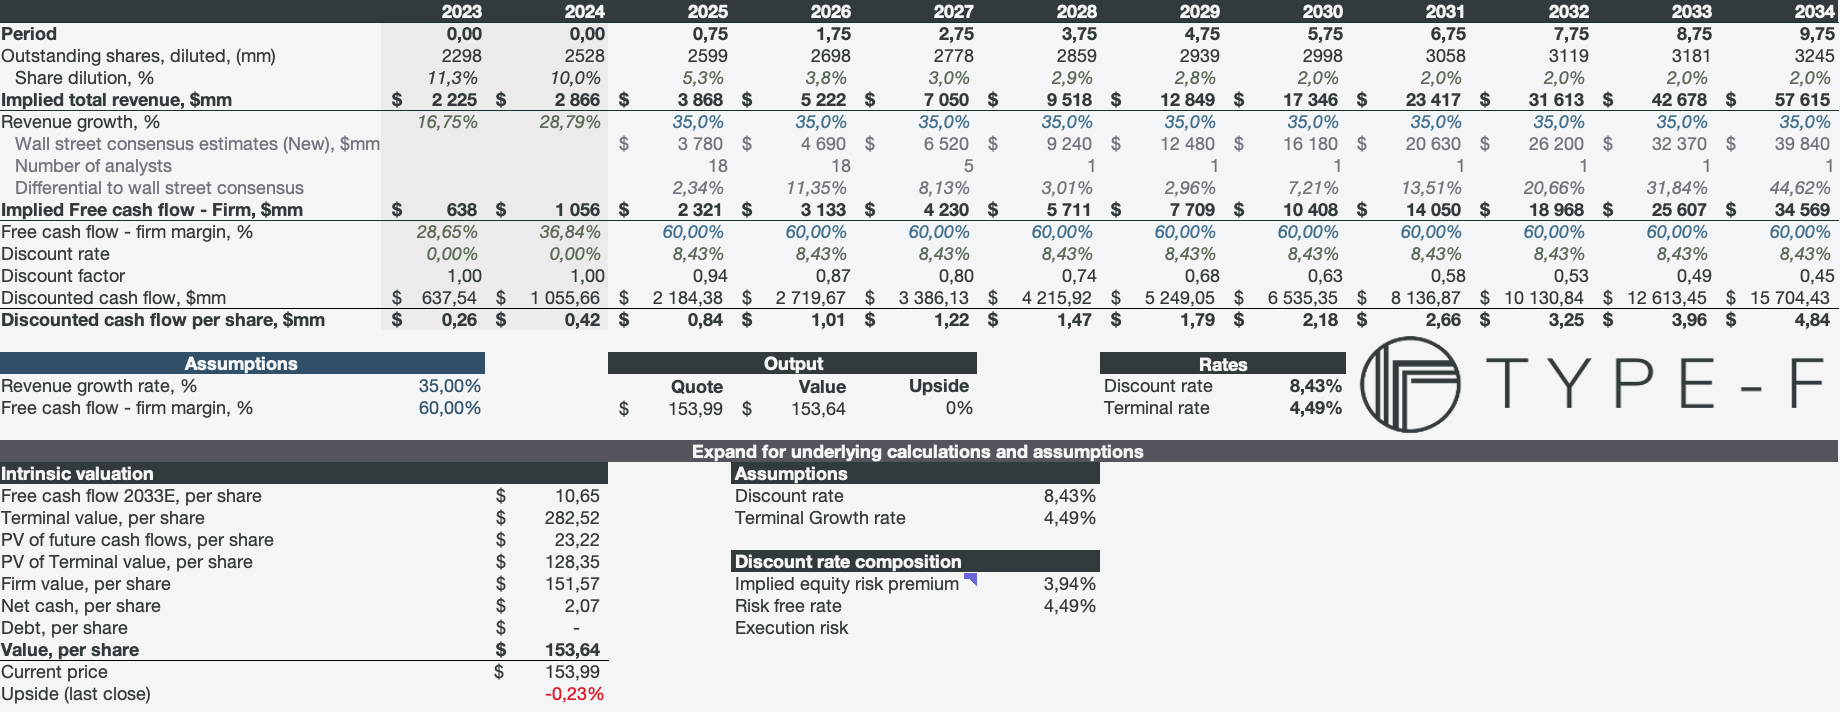
60% margins with 35% revenue CAGR over the forecasting period is not implausible. The interesting dynamic with Palantir is that the company significantly jumps in intrinsic value for each passing quarter. This is due to the company being very early in its journey, and each earnings call presents a lot of new information which deepens investors understanding of the business.
interesting where you get the cohort growth rates from?
$40b is 2/3rds Lockheed Martin. Seems unreasonable - I do not understand how people assume no competition for Palantir in 5 years either. Currently the DoD spends about $50b in IT and even if that goes to $150b I find it highly unlikely Palantir gets 30% of the government’s IT spend. And the bull case rests on assumptions like this.