


Companies want to go public at the height of excitement for their businesses, which is also why the quote often gets listed at a premium and subsequently sees an increase as investors pile in. In 2025, there were 90 IPOs, with a mean first-day return of ~30%. However, statistically, companies are down from their IPO highs after 12 months of trading. Those are statistics for the typical IPO, which SpaceX is anything but. A targeted ~$2 trillion valuation is unheard of and uncharted territory. When it comes to Elon Musk, staring oneself blind at IPO statistics is meaningless, and so too seems to be the financial history of SpaceX, given the targeted valuation.
If investors are purchasing the SpaceX IPO, it is for the narrative, not for the numbers that the business has put up historically, or even reasonably will put up over the next 10 years. SpaceX may have unparalleled potential among any publicly traded company, but it also comes with severe risks, most of which are tied to the valuation.
Company profile
Theme: Frontier, Direction: Sell
Symbol: SPCX, Exchange: NASDAQ
Fair intrinsic value: $458.14 billion, as of May 29, 2026
Targeted IPO valuation: $1,750- $2,000 billion
Major underwriters: Goldman Sachs, J.P. Morgan, BofA Securities, Morgan Stanley, Citigroup
Implied pricing data at $2 trillion: P/S 107x, P/E N/A
TYPEFCAPITAL.COM
Consider following me on X and YouTube.
This article is for informational purposes only and does not constitute investment advice or an offer to buy or sell securities.
All about the numbers
SpaceX operates three main business segments: space, connectivity, and AI, all of which are synergistic. Adopting X and its AI business at SpaceX enabled a powerful self-reinforcing loop, and it is all driven by the overarching goal of making human life multi-planetary.
Space and connectivity:
Reusable rockets drastically reduce launch costs, enabling more frequent deployment of low-Earth-orbit (LEO) satellites at a fraction of competitors’ costs.
Starlink (LEO) generates recurring, high-margin revenue that feeds directly back into capital expenditures for next-gen rockets and scale manufacturing.
AI:
Space’s payload capacity and orbital refueling capacity will enable orbital data centers in the future, where solar power and natural cooling provide AI with a structural cost and energy advantage.
AI is already present in rocket design optimization, autonomous landing and flight control, constellation management, and collision avoidance. Furthering SpaceX’s AI capabilities and Colossus compute accelerates SpaceX’s development cycles.
Starlink’s network traffic routing, predictive maintenance, and spectrum allocation can be optimized using AI. X integrations can drive new consumer and enterprise use cases on the network.
In short, connectivity’s cash flow subsidizes both Space and AI. Space’s cost advantages make connectivity difficult to compete with. AI’s compute scale and data from X and Starlink create a new high-margin revenue stream that further funds the other segments. The more satellites that are launched, the more cash SpaceX generates, which means more AI build-out, which turns into smarter rockets, which makes satellites cheaper, and the cycle repeats.
Figure 1: Segmented revenue
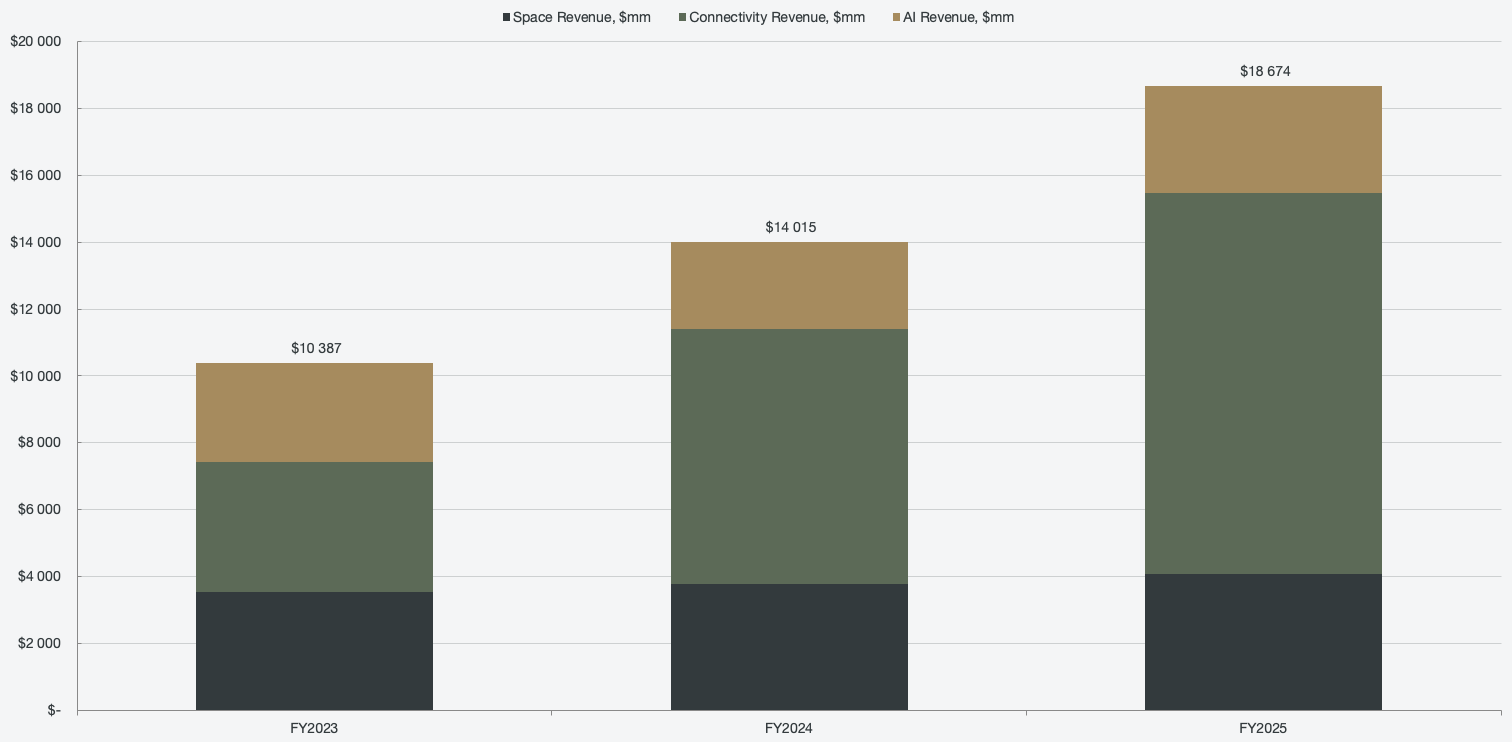
The business flywheel is solid, and it is hard to root against a company with such an inspiring long-term goal, but is it worth paying for? Total revenue has grown 33-35% over the past two years, and at a targeted $2 trillion valuation, the implied price-to-sales ratio is 107 times, and that’s without a price-to-earnings ratio since the business is not profitable.
As most readers know, I don’t put a lot of weight on pricing metrics as I prefer to focus on intrinsic value, especially in companies that are still relatively early-stage in their growth story. However, the satellite launch vehicle market (SLV) is expected to compound at 13% over the next 10 years (Global Market Insights), and the LEO market is expected to compound at 17% over the same period (Goldman Sachs). That’s not a market that would justify excitement to pay ~100 times revenue for. AI, on the other hand, is hard to gauge, but third-party estimates place expectations at 44% CAGR over the next 10 years (Precedence Research), something to definitely be excited about. But it is also the segment with the most competition, and Grok is not in a pole position to capture a majority of it.
Space
None of the markets is clearly defined, and the total addressable market size can change rapidly per segment. What we can do as potential investors, however, is to gauge how the businesses are developing and how SpaceX is setting up to capture potential TAM.
Space revenues have only grown in the single digits over the past two years, but the business development has been significant. Two core operational metrics that SpaceX provides in its S-1 filing are the number of launches and the mass to orbit. Higher mass and more frequent launches mean more billable payload, as government contracts and commercial customers pay based on capability and reliability.
SpaceX had 170 launches in 2025, which accounts for about half of all global orbital launches. Number two is China as a whole, with about 90 launches, most of which were expendable rockets, and with lower mass per launch. Third place is Rocket Lab with 21 launches, with much smaller payloads. The launch cadence alone speaks of SpaceX’s clear market dominance, but it is also important to note that almost all competitors operate on expendable vehicles and have higher costs per delivery. The resuability advantage is massive, and Starship will further widen the gap.
Figure 2: Mass per launch and revenue per ton to orbit
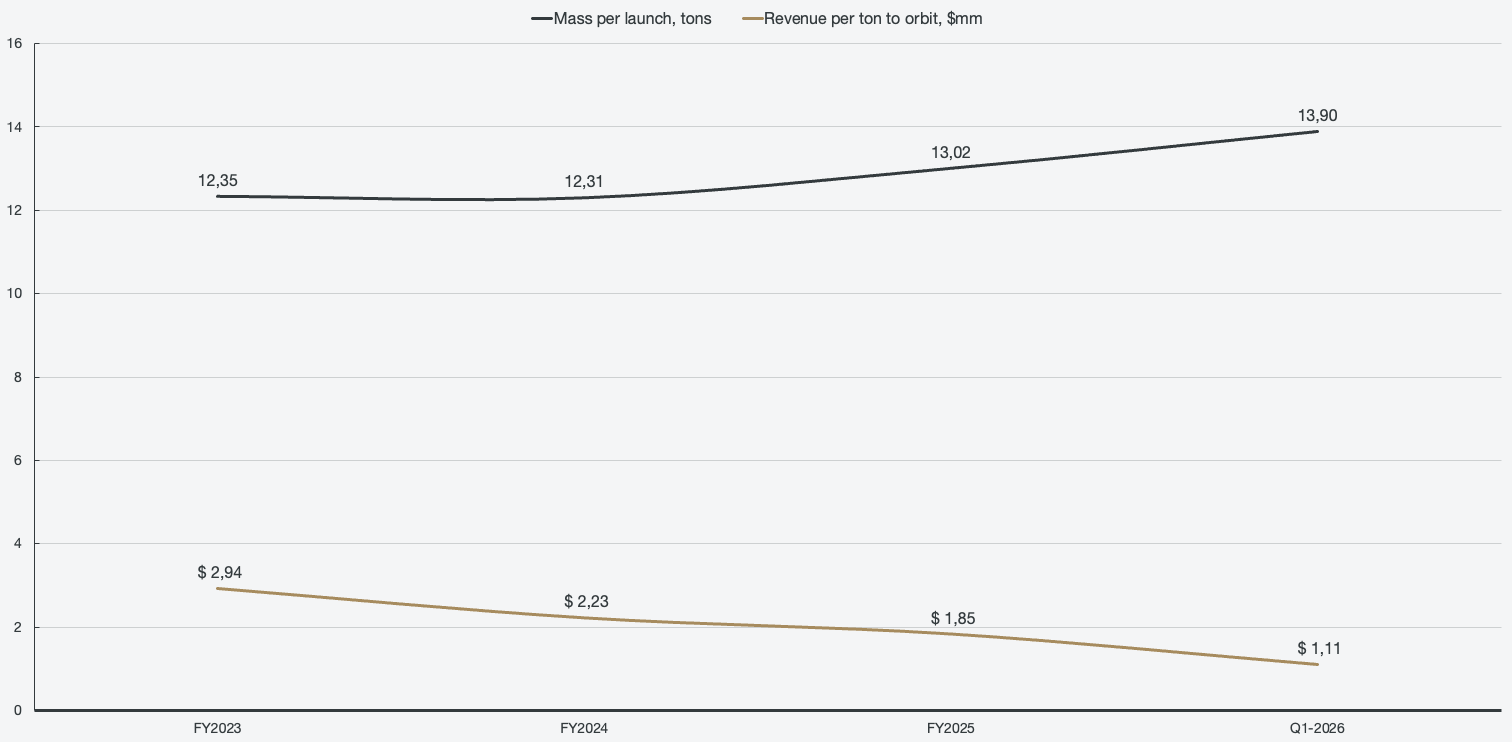
Looking at the operational metrics, it is clear that SpaceX is becoming more efficient with its payloads, as they are able to bring more tons into orbit per launch. However, the revenue per ton to orbit is rapidly declining, which may seem alarming. Revenue per ton to orbit translates to pricing power per unit of capacity delivered, where a falling metric means that scale is beating price, which is actually the bull case. Capacity is scaling far faster than the revenue dollars, which is expected when launch costs are collapsing, and Starlink is the dominant payload, as they fly their own cargo for free. SpaceX is already dominant, and making use of the capabilities to accelerate Starlink’s growth will feed right back into the company’s multiplanetary ambitions as Starlink generates funds to advance space capabilities even faster. When the payload mix shifts more heavily towards contracted payload, the unit economics of the business will change rapidly.
Connectivity
Global connectivity has an increasingly broad application and market, one that is just now starting to take shape. SpaceX themselves estimate the total market opportunity to be $1.6 trillion across consumer use cases, and that is without accounting for connectivity evolving into a critical infrastructure layer for the global economy. Historically, Starlink has primarily been used to serve the 40% of the global population that lives in rural areas, where terrestrial broadband infrastructure is not developed. And while rural and underserved geographies have been the primary target for Starlink historically, that is now quickly changing as Starlink begins to compete materially in suburban and urban environments.
Consumer broadband opportunities are just one side of the coin, though, as enterprise solutions are quickly gaining traction as well. SpaceX’s connectivity offerings are used across a wide variety of industries, including construction, agriculture, retail, telecom and hospitality. For example, we have seen an increasing number of airlines adopt Starlink for their on-board WiFi, most recently American Airlines.
Applications across government use cases are also rapidly increasing, as demand for resilient, low-latency, and secure communications in contested and remote environments is increasing.
In a mere two years, Starlink subscribers have increased by 448%, and Q1 2026 connectivity revenue alone just about equals the revenue for the full 2023 fiscal year. Not only is the adoption and revenue ramping up quickly, but so too is the margin expansion in the segment. As mentioned earlier, Starlink is the main cash generator of the business, which is necessary to allow the advancement of the space and AI segments.
Figure 3: Starlink subscribers
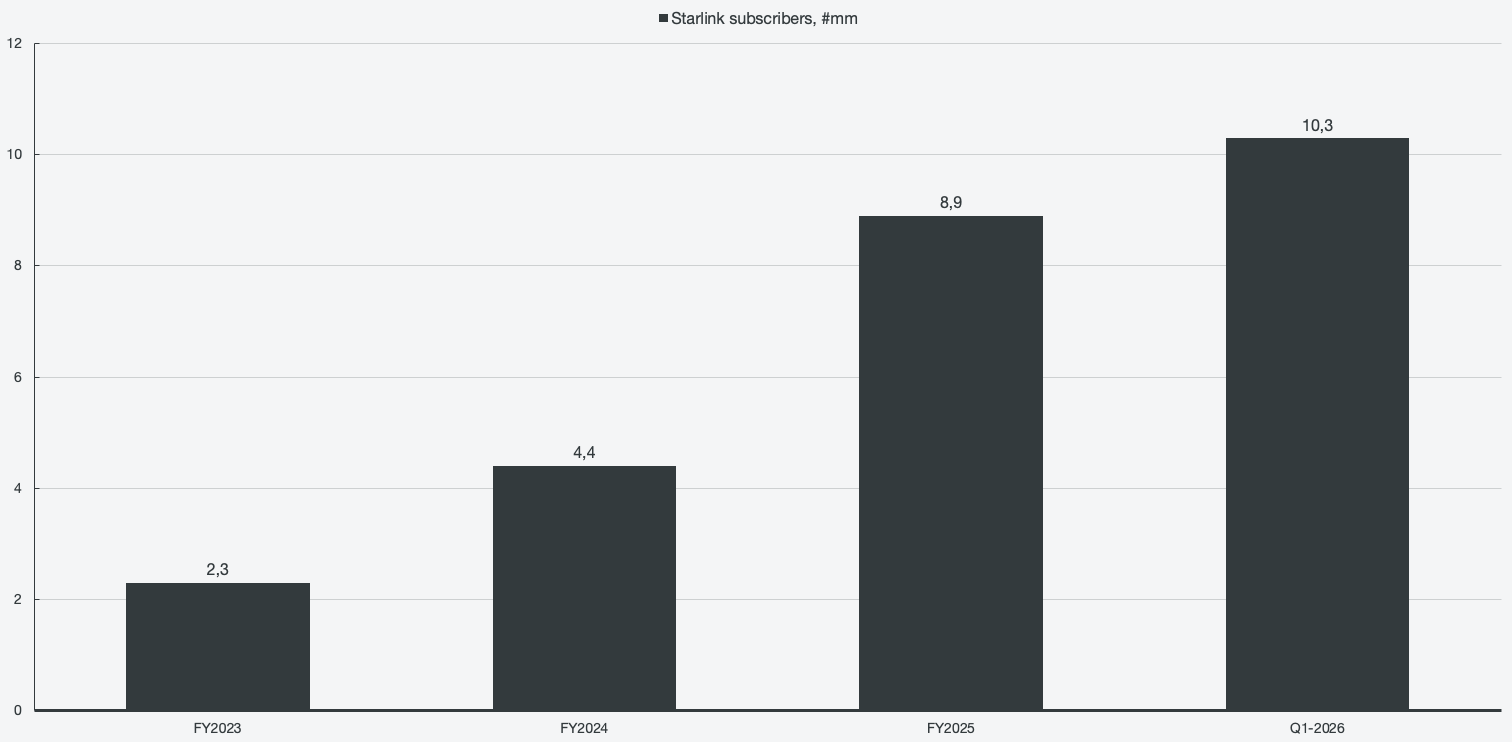
Similar to revenue per ton to orbit, Starlink's average revenue per user (ARPU) is dropping rapidly. However, much like with revenue per ton to orbit, it is not alarming but by design. The metric has to be looked at from a broader perspective. While ARPU is dropping, revenue for the segment has tripled over the same period, and the subscriber base has exploded. Simultaneously, operating margins have more than tripled.
Figure 4: Starlink average revenue per user
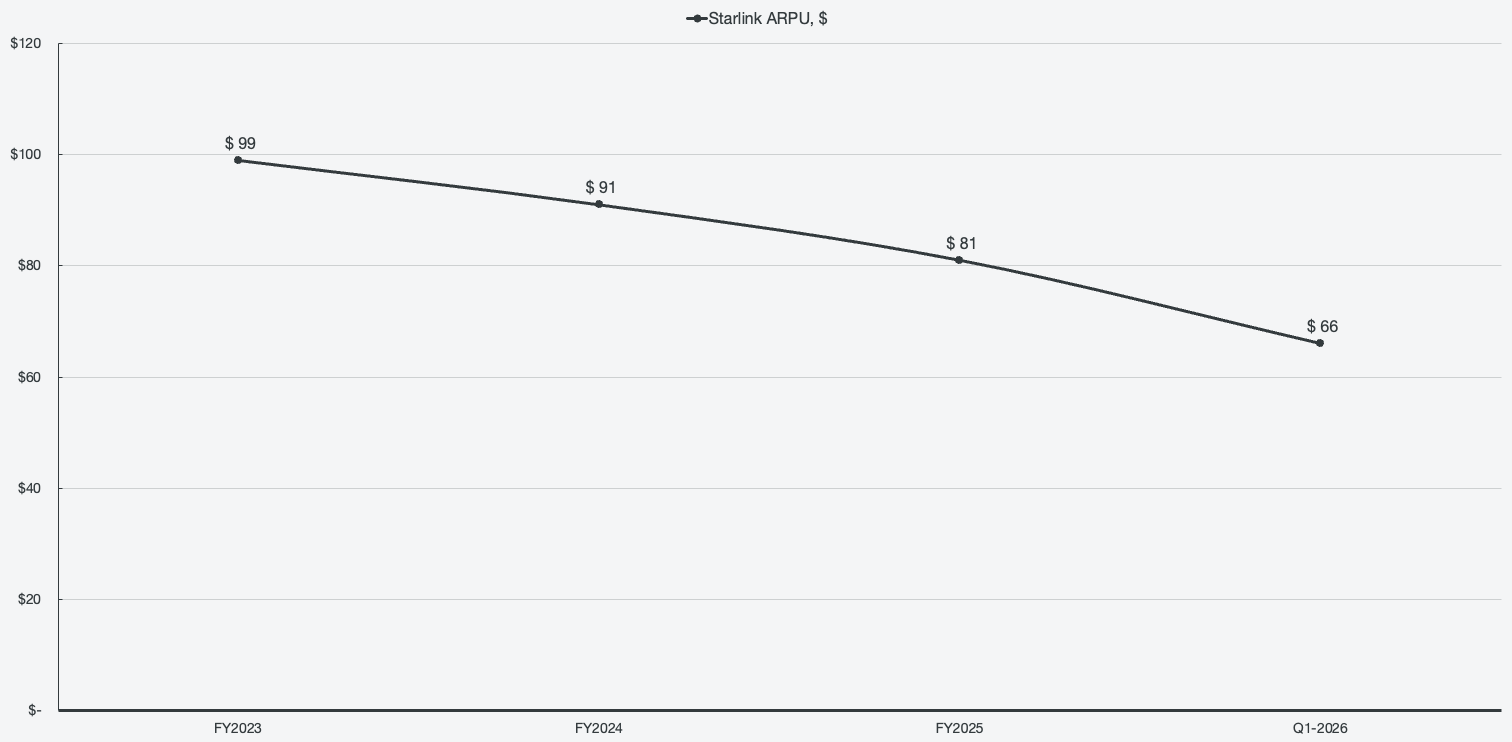
It is a case of a classical market penetration strategy, as is the case with many now successful platforms like Netflix, Amazon, and even Tesla with its Roadster. Early adopters are premium customers who pay high rates, and as the service expands globally and across more diverse use cases, ARPU drops. In order to reach the full breadth of the market, Starlink has to move down-market, which means pricing the service competitively. A dropping ARPU would be alarming, but only if it happened without a corresponding subscriber growth. SpaceX is prioritizing market share, global coverage, and long-term network effects over shorter-term per-user metrics.