Type-F Research Resources (Robinhood, Palantir)
Excel data sheets with valuation models and charting tools

NOTE: This is an advertisement for my Type-F Capital data sheets.
Skip this article if you are not interested in them.
The Type-F data sheets for Robinhood Markets and Palantir Technologies have been updated for the Q3 results!
There is a 30% discount for all paid subscribers. See the end of the article.
I personally compile all the data you see on this Substack and also create each chart myself. Specifically for Palantir and Robinhood, I have professionally formatted my financial models and made them available for purchase on Type-F Capital.
The data sheets include a dashboard, over 1000 rows of financial data and KPIs dating back to the S1 filings and beyond, a dynamic charting tool, and my valuation models.
Free updates are sent out on a quarterly basis.
Figure 1: Robinhood Markets dashboard

Figure 2: Robinhood Markets financial data, with triggers for annual and quarterly data
Figure 3: Robinhood Markets Dynamic charting tool, with triggers for annual and quarterly data
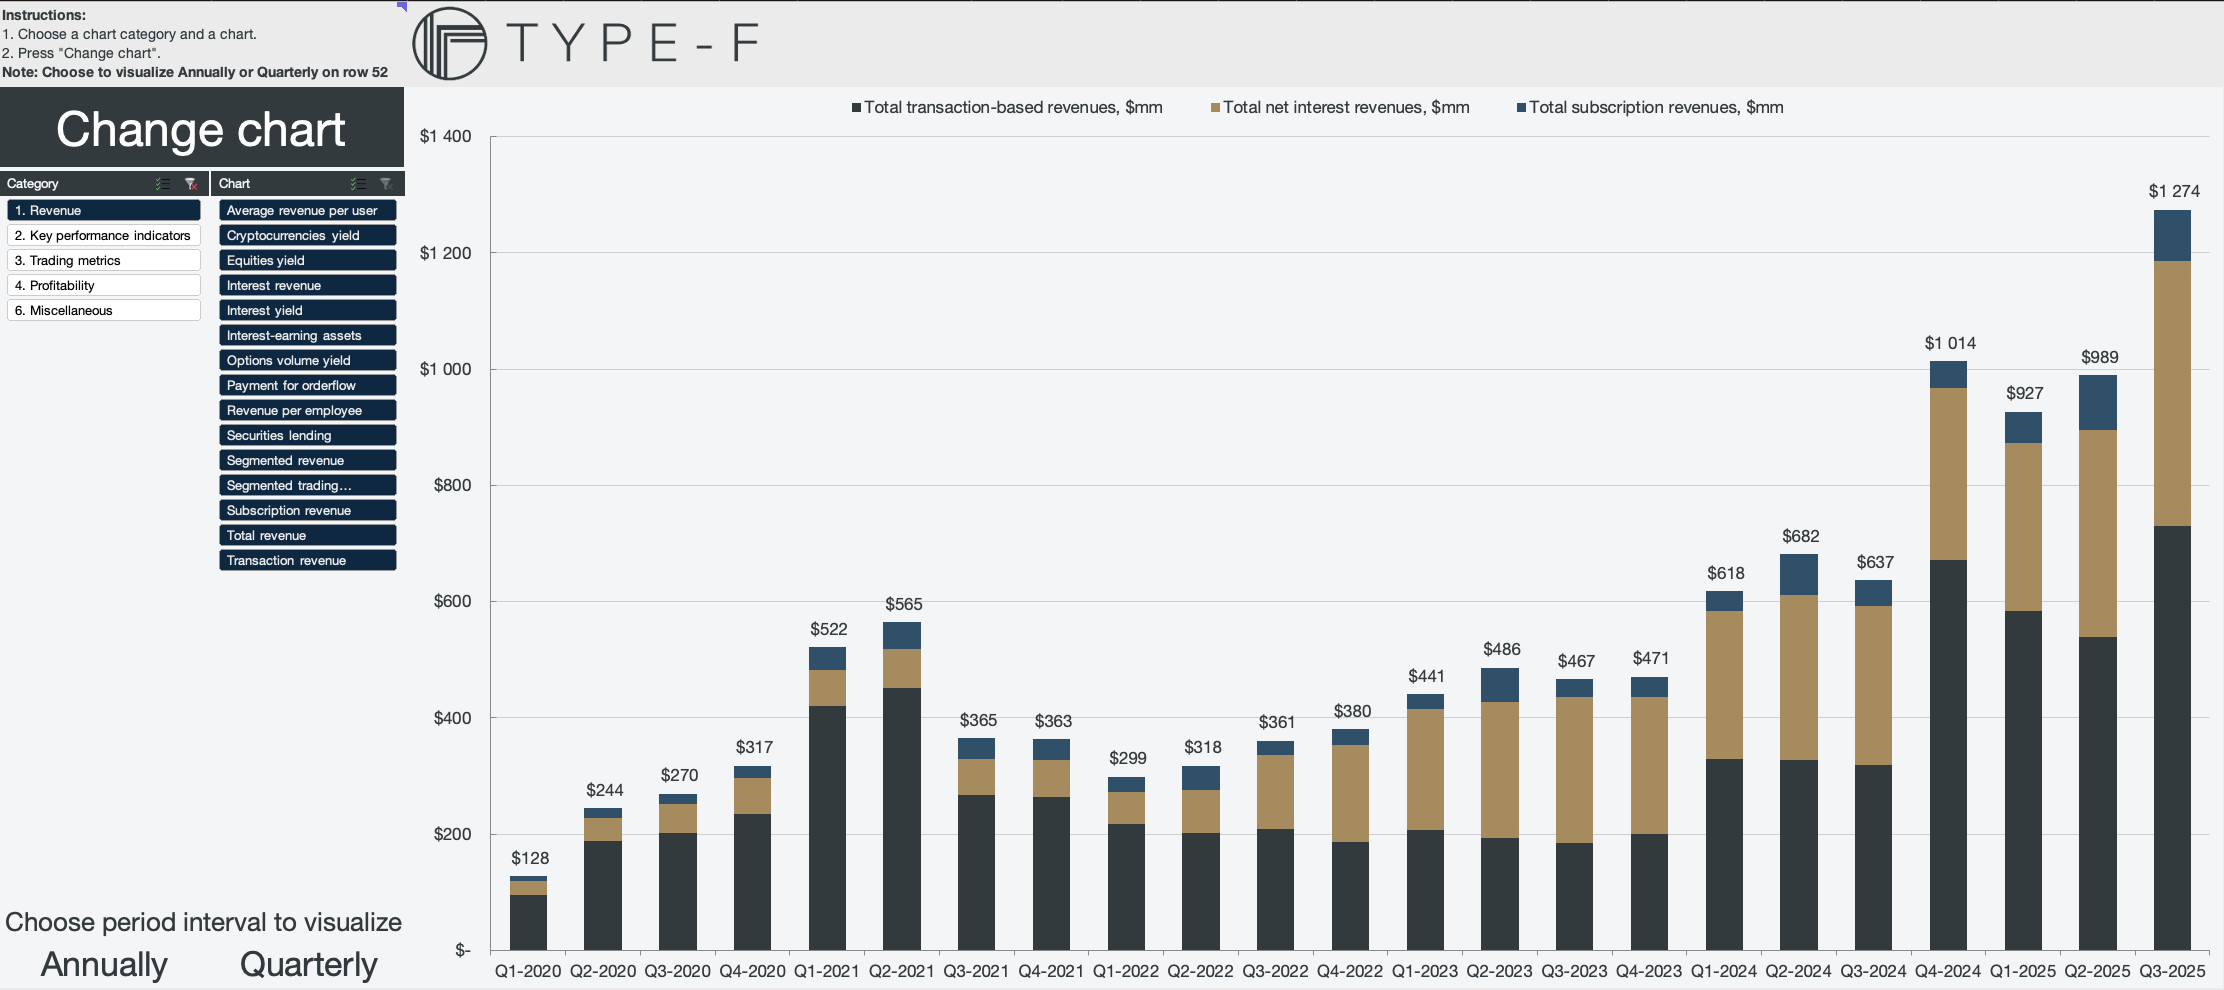
Figure 4: Robinhood Markets valuation model (blurred)
These are available on https://typefcapital.com, and there is a bundle with a discount if you purchase both (the paid subscriber discount applies on the bundle as well).
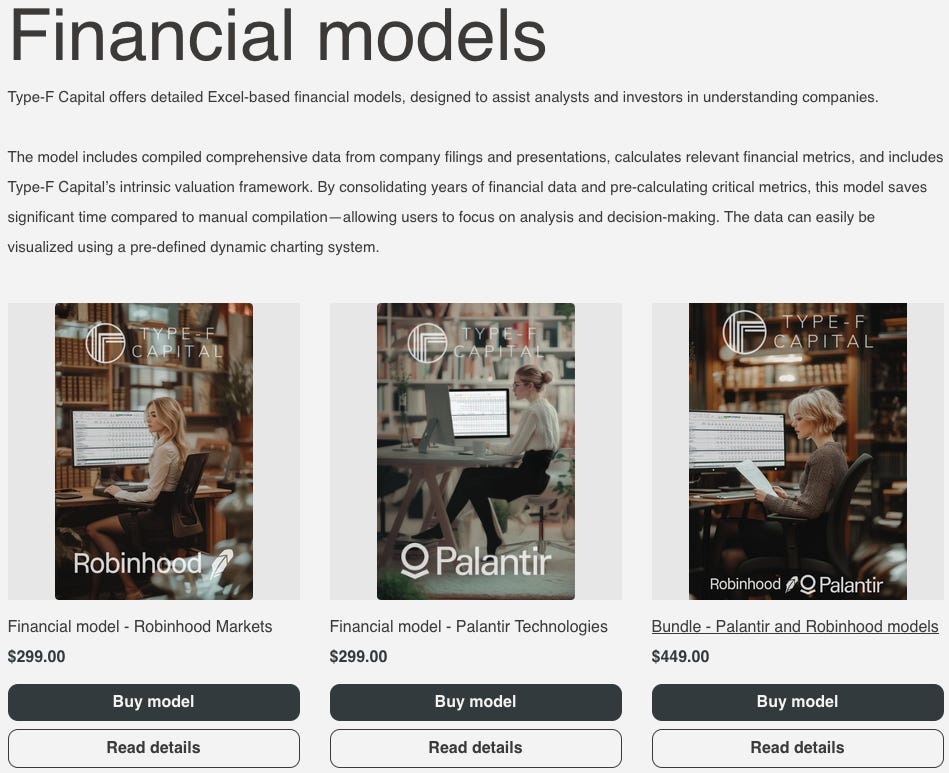
Figure 5: Financial models on https://typefcapital.com