

Palantir Technologies: Q2 Results Are The Best In Software History
Equity research follow-up coverage, rating unchanged

I often get asked why I keep a hold rating on Palantir, despite the company trading seemingly overvalued. Palantir’s Q2 2025 earnings results perfectly demonstrate why I am cautious about a sell rating on Palantir. Fair intrinsic value represents the narrative of a company as we understand it through numbers. Palantir is the type of business that is difficult to grasp, and the more investors learn about the business, the higher the fair intrinsic value tends to go. In particular, this quote from the earnings call stands out:
…So in the near future, the 10x revenue we are going to get in the U.S. over the next, in my view, next 5 years…
Alex Karp, Chief Executive Officer
Palantir Technologies Inc, Q2 2025 Earnings Conference Call
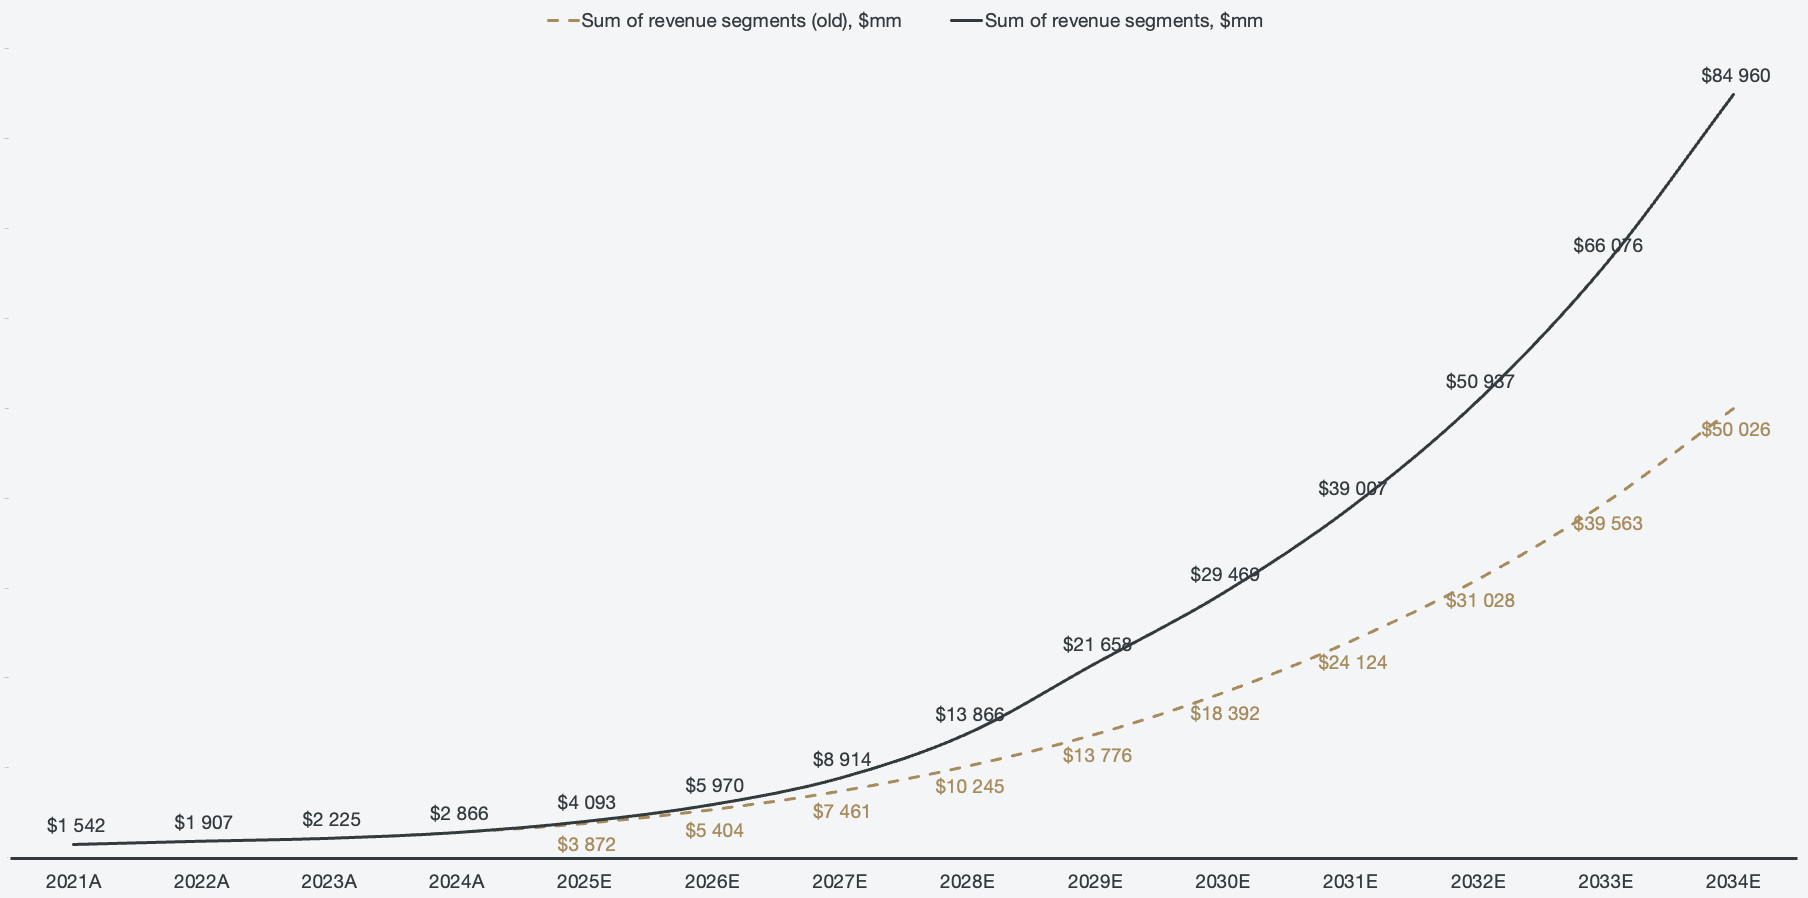
This quote significantly increased fair intrinsic value, and my previous optimistic revenue forecast now seems insignificant compared to my new one.
Figure 1: Revenue forecast comparison
Company profile
September 8, 2025 Follow-up coverage
Direction: Hold
Previous fair intrinsic value: $71.06, as of July 18, 2025
Symbol: PLTR, Exchange: NASDAQ
Sector: Technology, Industry: Software - Infrastructure
Theme: AI Software
Fair intrinsic value: $135.83 (-11.28%), as of September 8, 2025
Market capitalization: $392 407 million
Pricing data: P/S 114x, P/E 508x
Previous coverage:

TYPEFCAPITAL.COM
Consider following me on X and YouTube.
This article is for informational purposes only and does not constitute investment advice or an offer to buy or sell securities.
No signs of slowing down
As Palantir’s stock quote implies, there are significant expectations of excellence from investors. Palantir has traded expensively for a prolonged period of time, yet the pricing multiples keep expanding instead of retracting. The reason is that Palantir goes from brilliance to brilliance for each passing quarter, and Q2 might be the best software financial results I have seen on a quarterly basis.
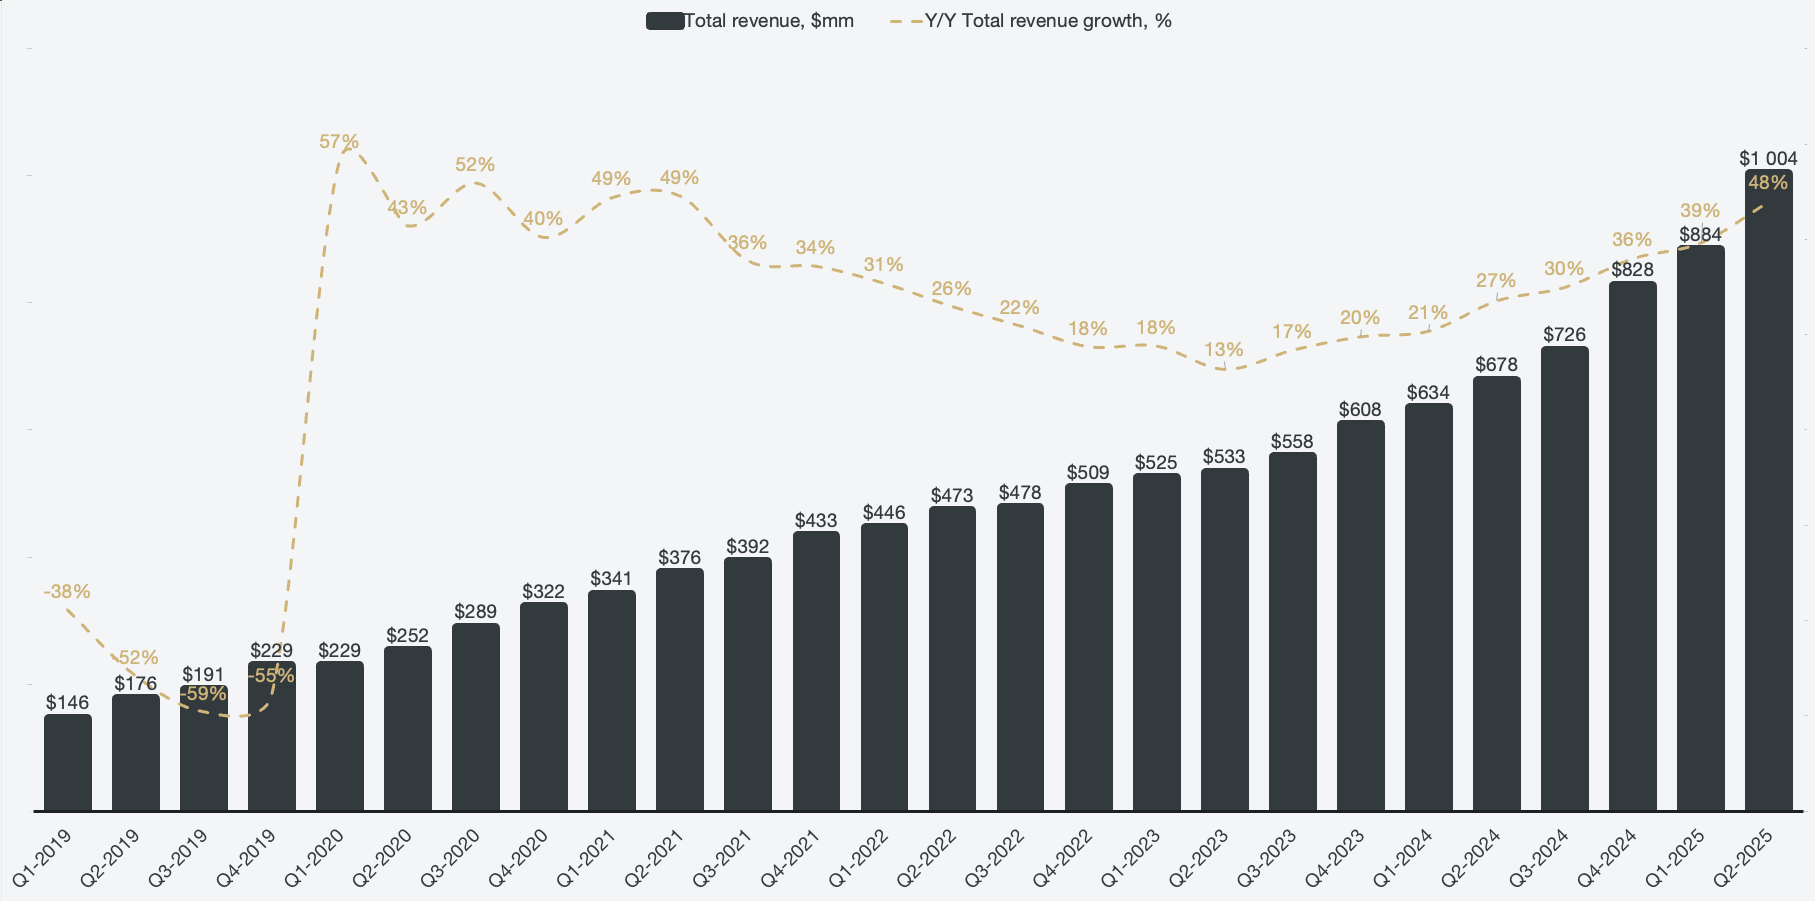
The biggest question on most investors' minds going into the quarter was if Palantir would be able to continue accelerating their growth. The company used to grow in the 50% range, which turned into the 30% range, and steadily declined all the way down to 13%. Since then, AIP launched, Palantir adopted the bootcamp go-to-market strategy, and revenue growth reversed its trajectory. From 13% at the lowest point to 48% as of Q2 2025. The most stunning result is that the rate of acceleration has been increasing, not decreasing. Palantir grew 39% Y/Y in Q1 and accelerated to 48% Y/Y in Q2 while guiding for further acceleration.
Figure 2: Quarterly revenue and revenue growth
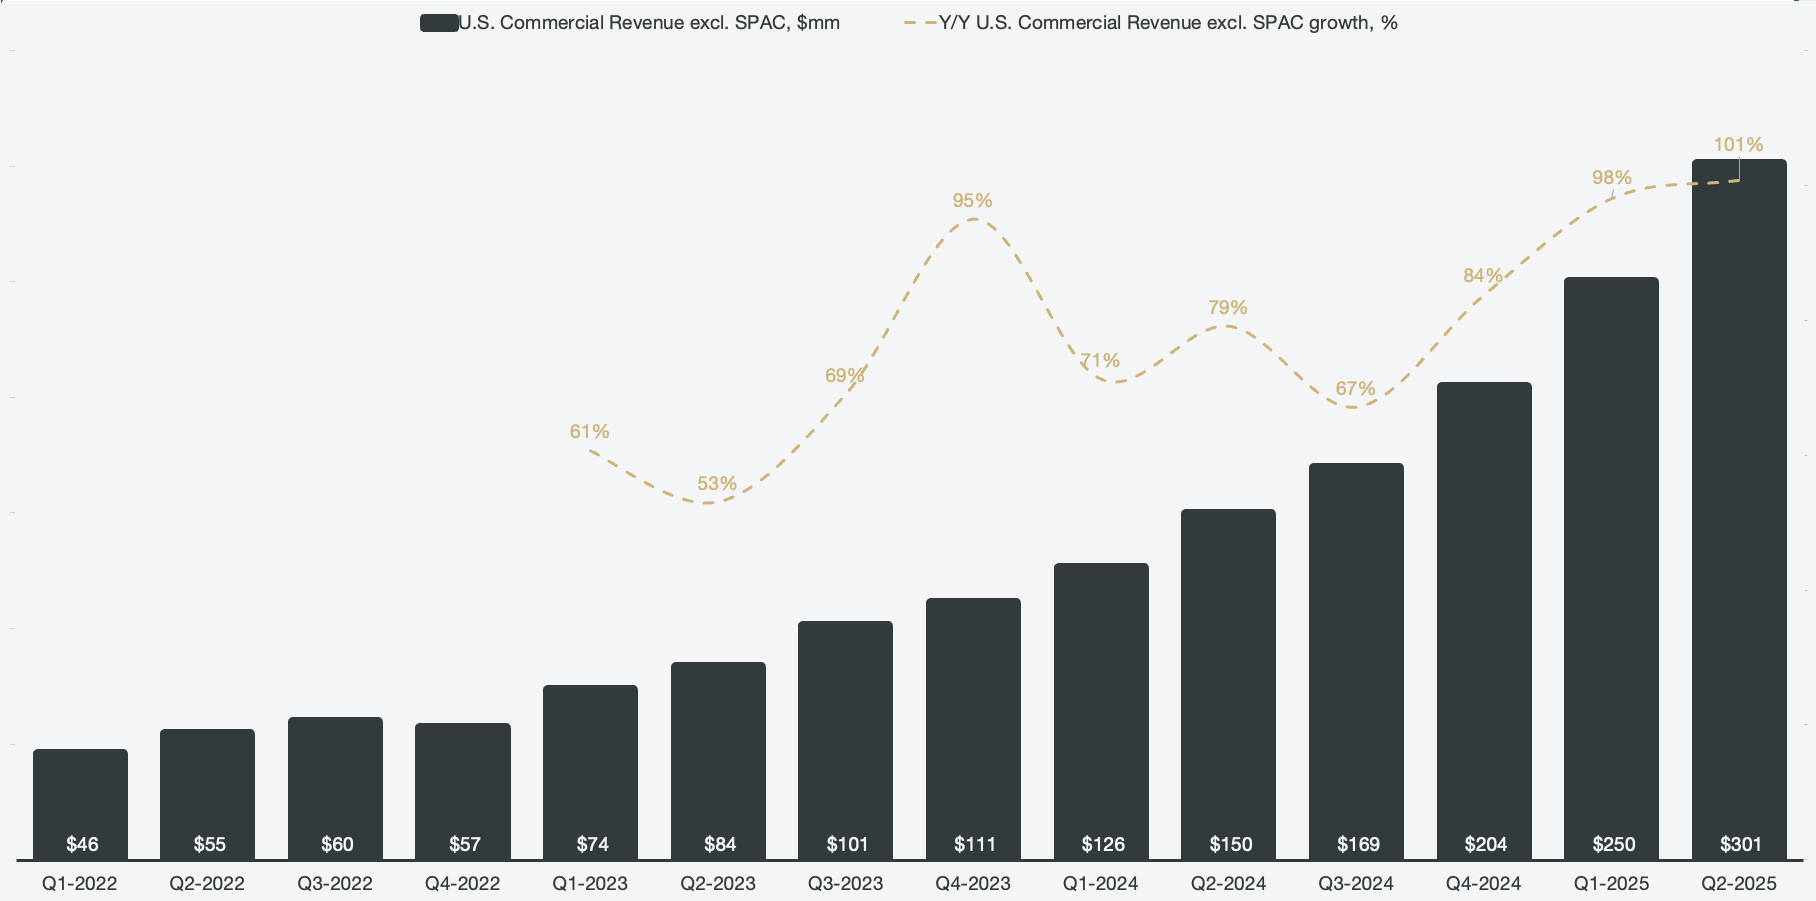
The primary beneficiary of the AIP scale-out is currently the U.S. commercial business, which grew a staggering 92% Y/Y. However, when only looking at organic growth (excluding SPACs), U.S. commercial revenue growth crossed triple digits and grew 101% in Q2.
Figure 3: Organic U.S. Commercial revenue growth
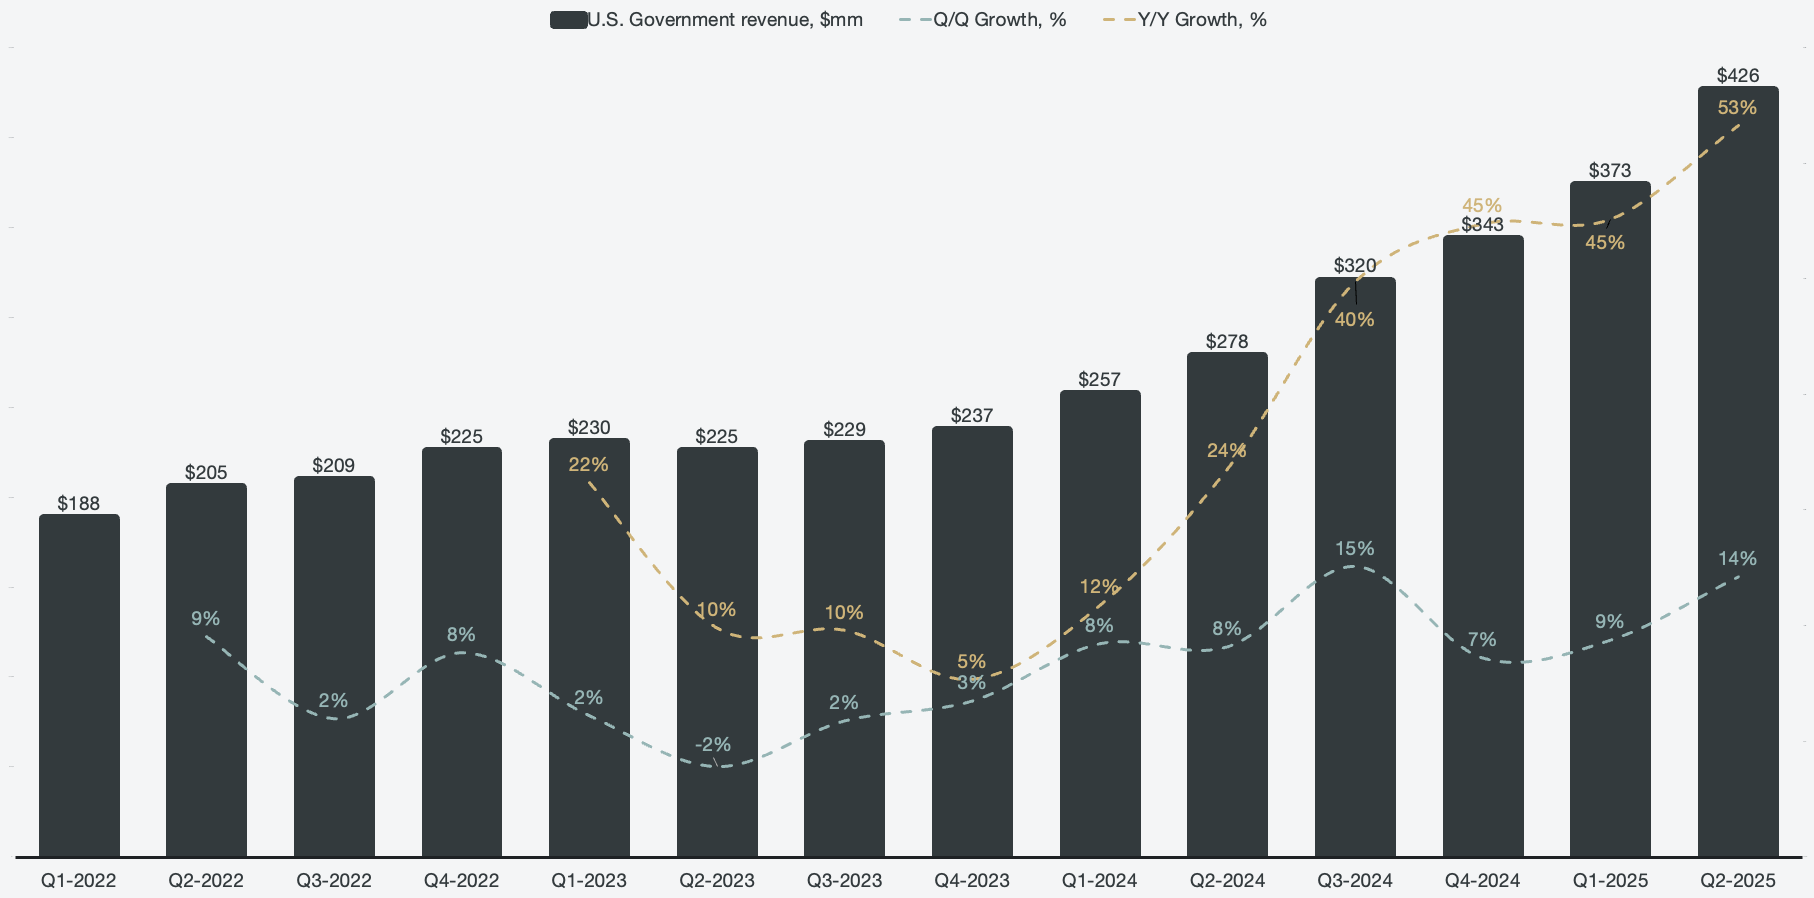
Another impressive chart is the U.S. government growth, which has accelerated from 5% Y/Y in Q4 2023 to 53% as of Q2 2025. The government side of the business does not see the same benefits of a bootcamp strategy the same way the commercial side does, which makes the accelerated growth even more impressive. The expansion into the U.S. government signals an increasingly heavy reliance on Palantir products. Many investors are under the assumption that Palantir is only used within a defense context, but in reality, Palantir is actively used in more than 15 different agencies. Serving as the operating system of the modernizing U.S. government will serve as incredibly sticky and high-margin revenue for Palantir.
Figure 4: U.S. Government revenue growth
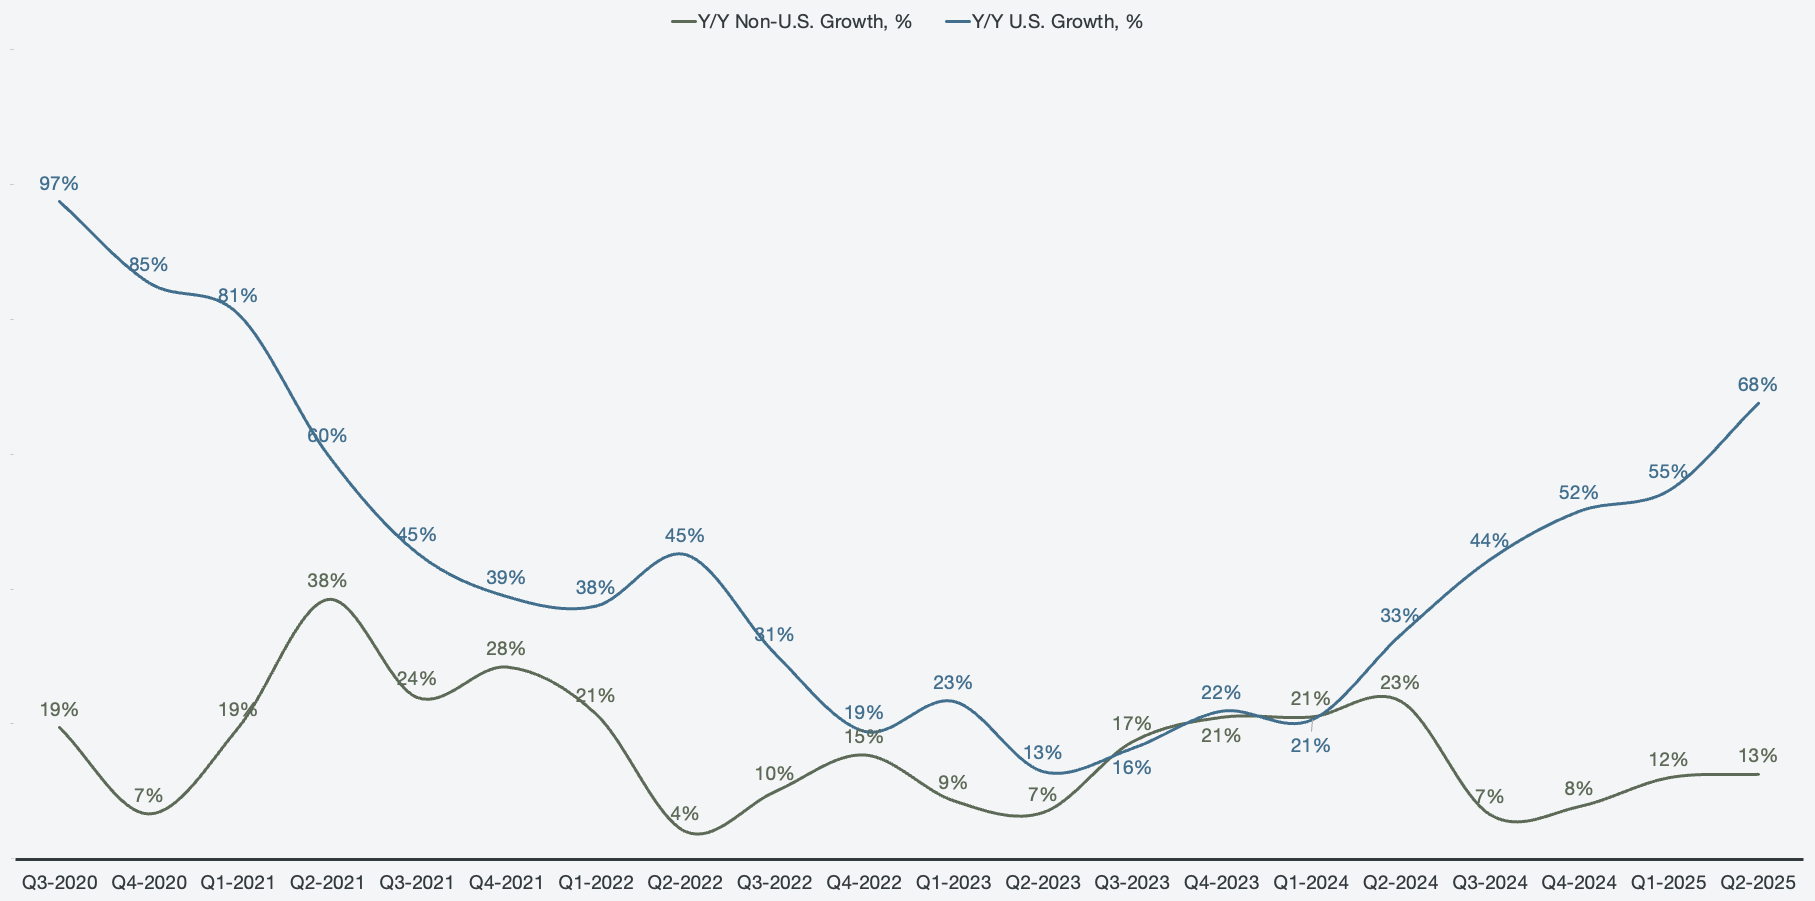
If Palantir were merely serving the U.S., revenue growth would have been 68% Y/Y for the quarter. However, Palantir has a drag on its overall revenue results, and that is all primarily Europe. Non-U.S. commercial growth has been non-existent for years. Non-U.S. governments do see some growth, but the rate is incomparable to the U.S. counterpart recently. However, a reacceleration is occurring on the non-U.S. government side, and it has outgrown the U.S. government over the past three years (119% non-U.S. growth vs. 108% for the U.S. government since Q2 2022). The impressive part is that Palantir is about to grow 50% Y/Y in Q3 2025, with a third of its business only growing a modest 13%.
Figure 5: U.S. and Non-U.S. growth comparison
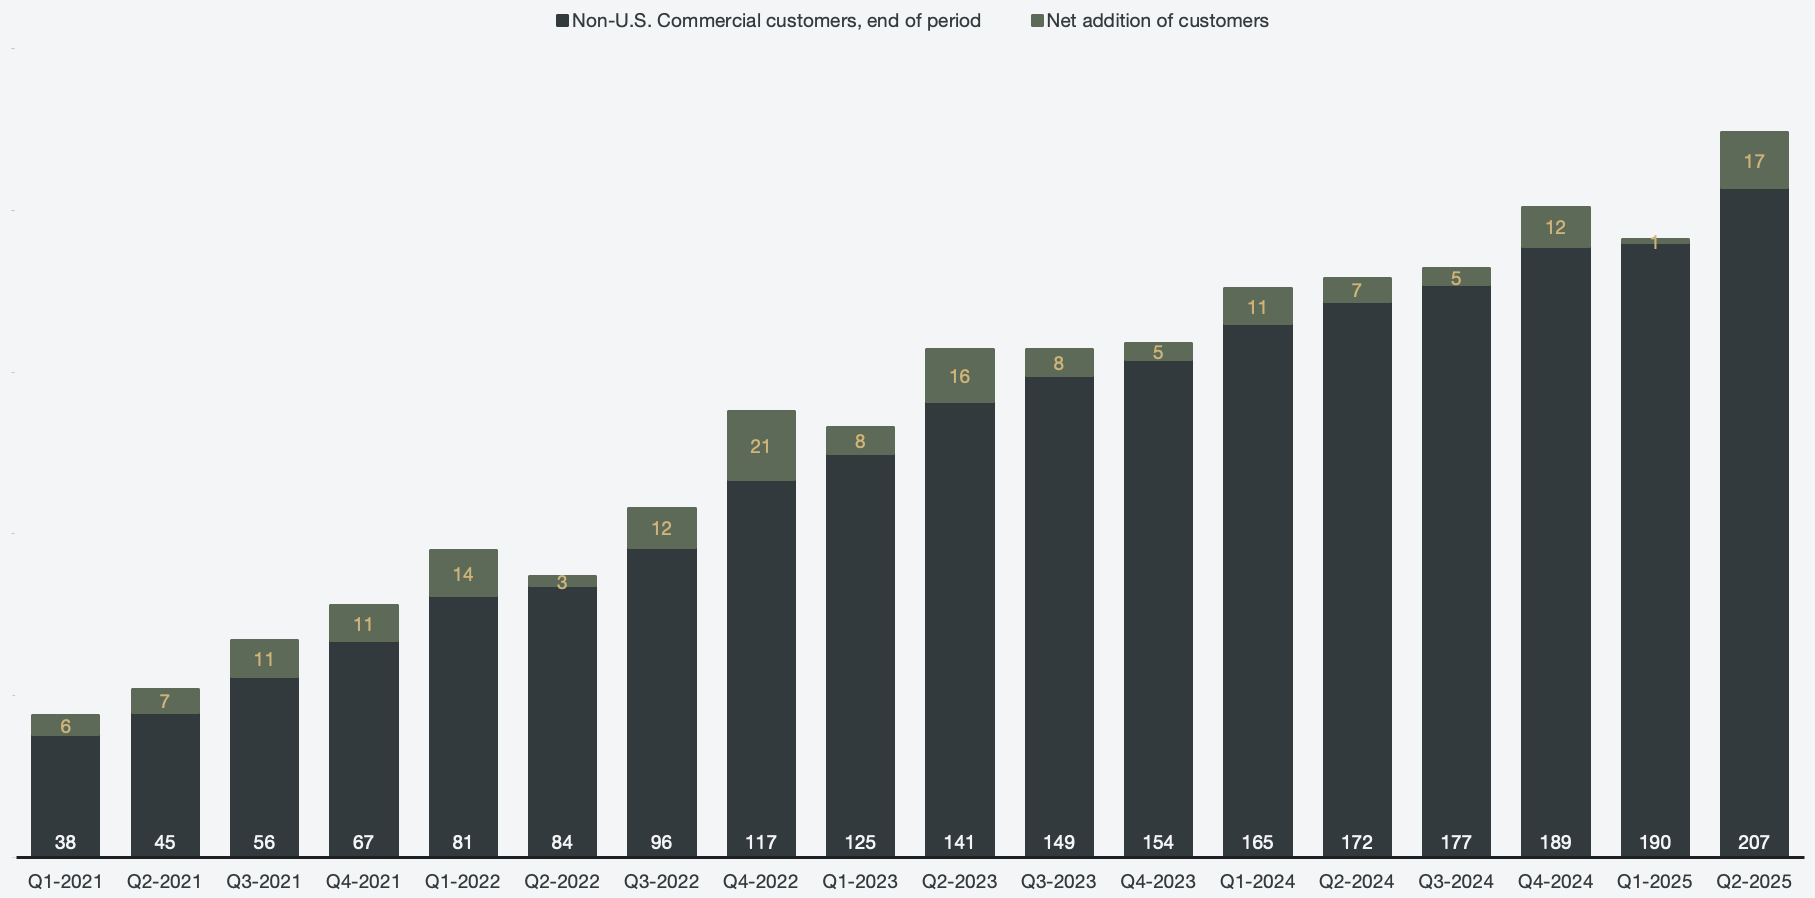
The sheer potential of Palantir’s growth potential is difficult to grasp since a real expansion outside of the U.S. has not yet begun. However, the argument for a prolonged period of impressive growth is strengthened by the fact that Europe and Asia are underperforming. Once these regions wake up to being left behind in terms of GDP growth, military might, and business competitiveness, growth rates for Palantir’s overall business might hit triple digits. That moment may not be too far out, as Q2 recorded a sharp increase in the net addition of non-U.S. commercial customers. 17 additions in a single quarter is the highest since the all-time high, which was 21 in Q4 2022.
Figure 6: Non-U.S. commercial customer count
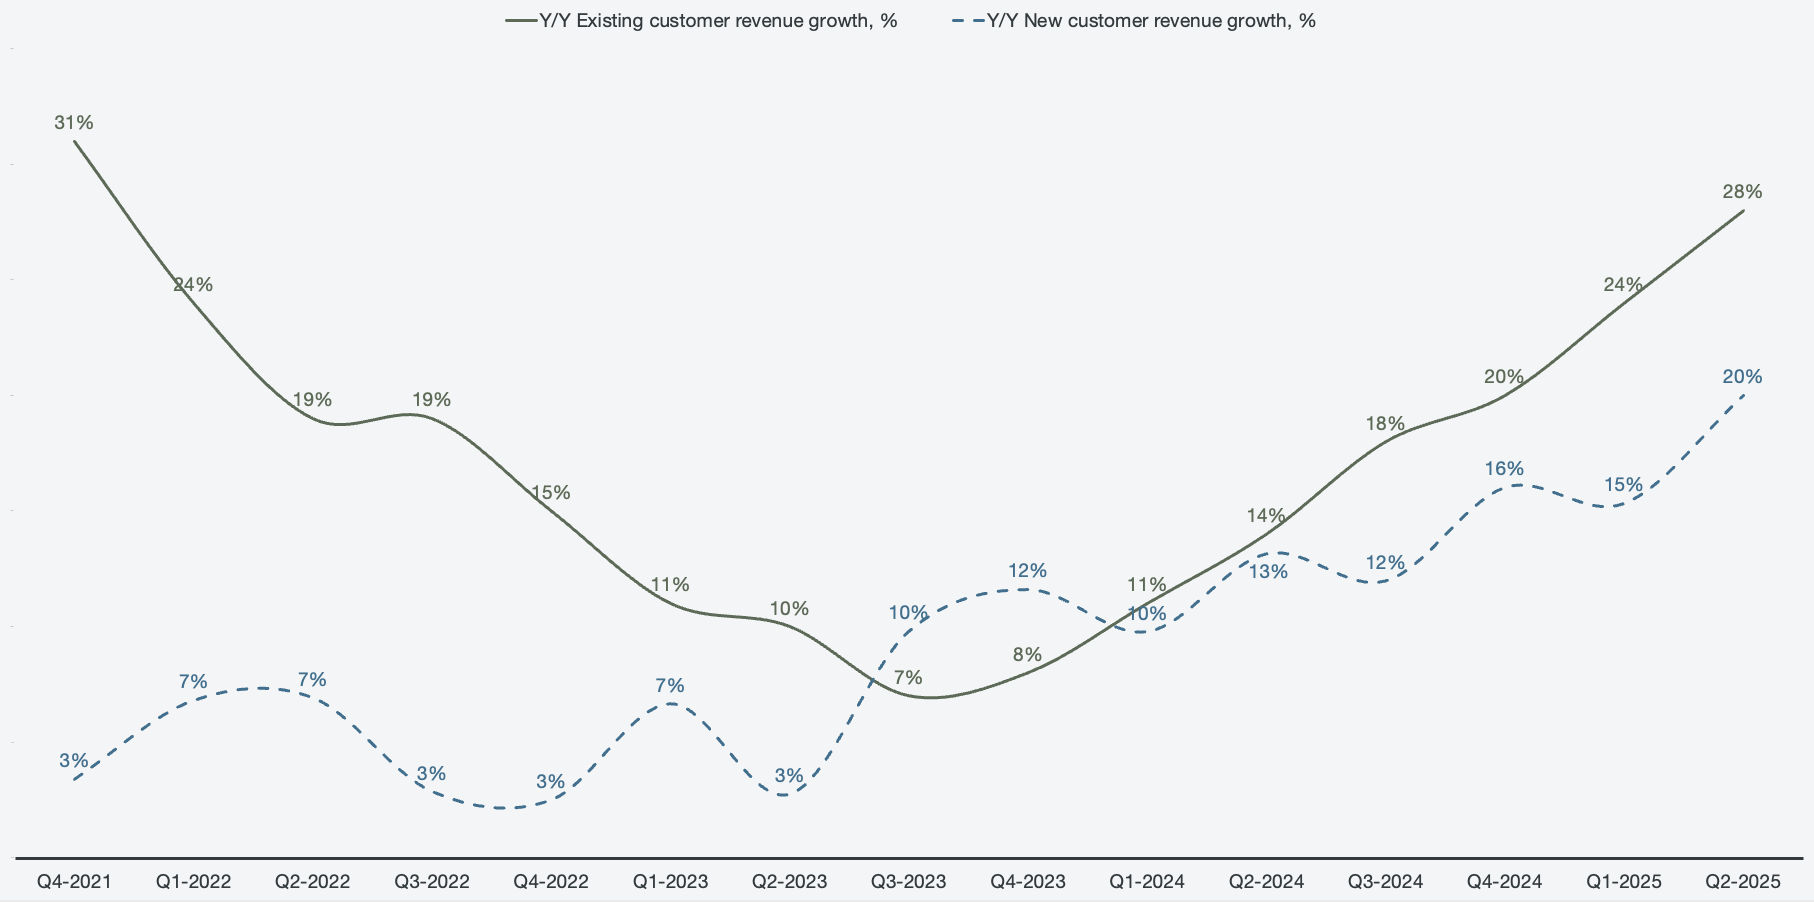
The recurring question then remains, for how long is this sustainable? I mentioned in my previous coverage that the key to sustainable and high growth rates is the scalability of existing customers. The net dollar retention rate, which shows how much existing customers are increasing their spending, is the key to this metric, and it further accelerated in Q2. 28% of the 48% Y/Y revenue growth came from customers that have been with Palantir for more than 12 months, and it has been increasing for 7 quarters in a row. In essence, without any new customers contributing to revenue growth, Palantir still would have grown ~30%.
Figure 7: Cohort growth rates
AIP is set up to price per usage of the platform. Employing AIP to solve one business use case may not lead to a lot of revenue increase, but employing AIP across a whole business might double or triple the revenue Palantir recognized from Foundry alone.
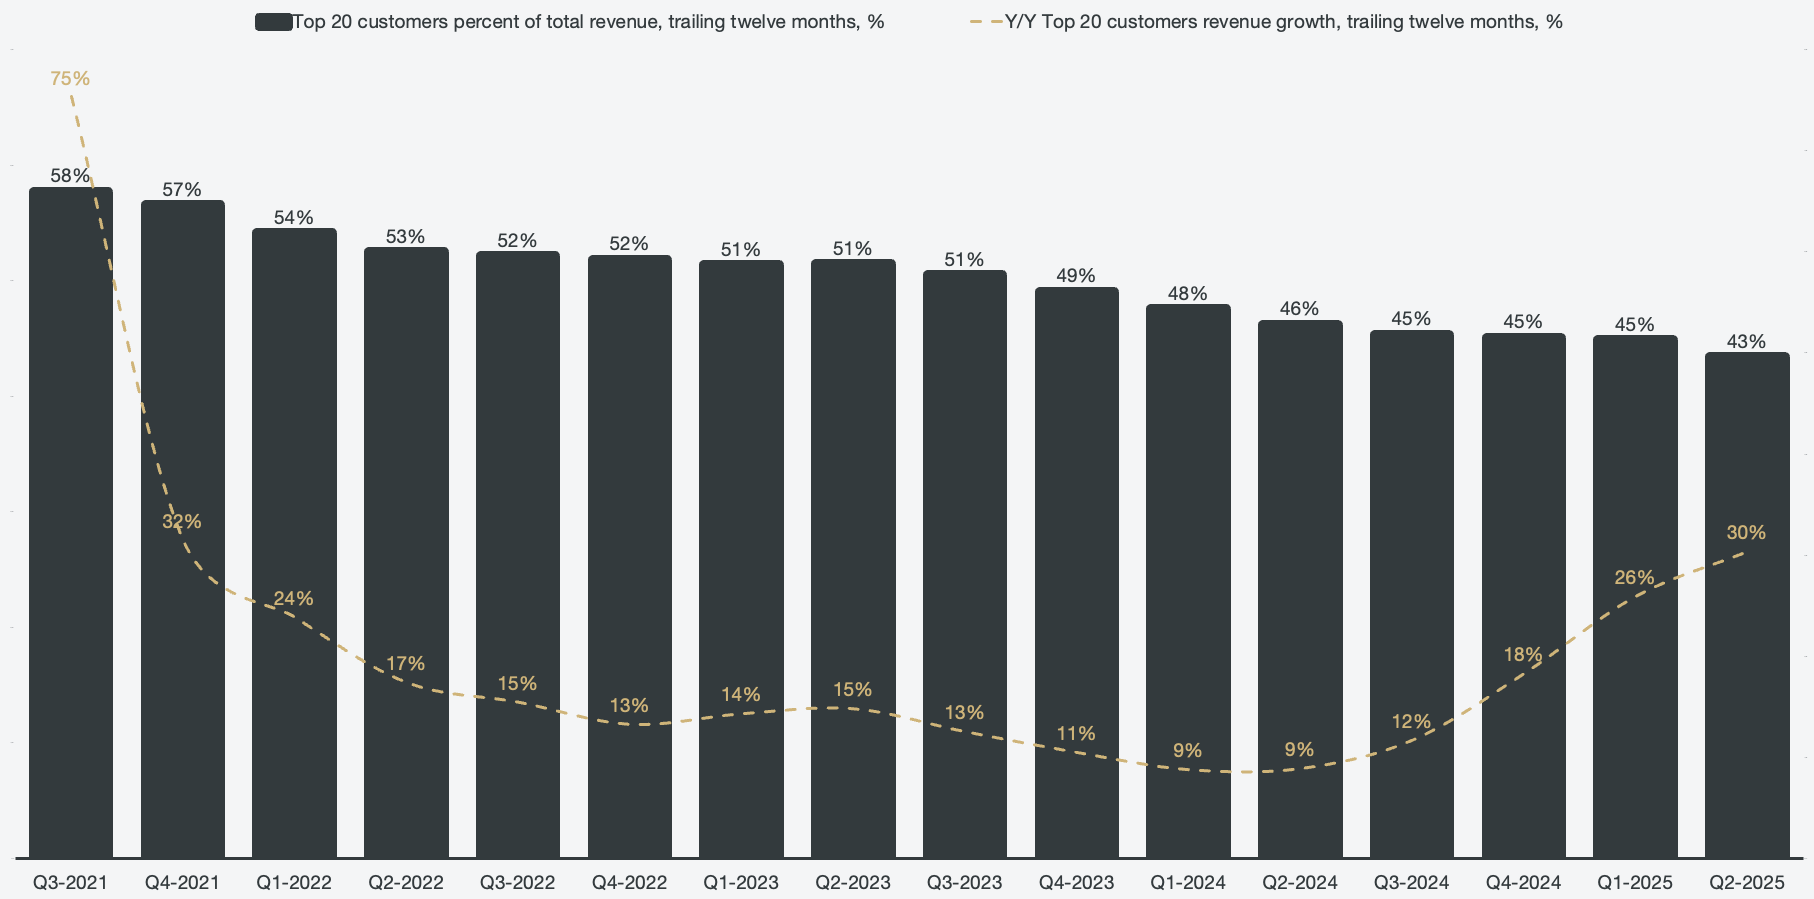
It’s impressive that Palantir’s 20 largest customers account for ~45-50% of overall revenues historically. This cohort has been regarded as a major concentration risk for Palantir. I always disagreed with that sentiment; rather, I saw the top 20 customers as a safety net for Palantir to have leeway to find ways to grow the other parts of their business. This massive cohort, which accounts for $1.5 billion of revenue on a trailing-twelve-month basis, outgrew the overall existing customer cohort on a TTM basis.
Figure 8: Top 20 customers’ percent of overall revenues and growth, TTM
Contract balances suggest sustainable growth
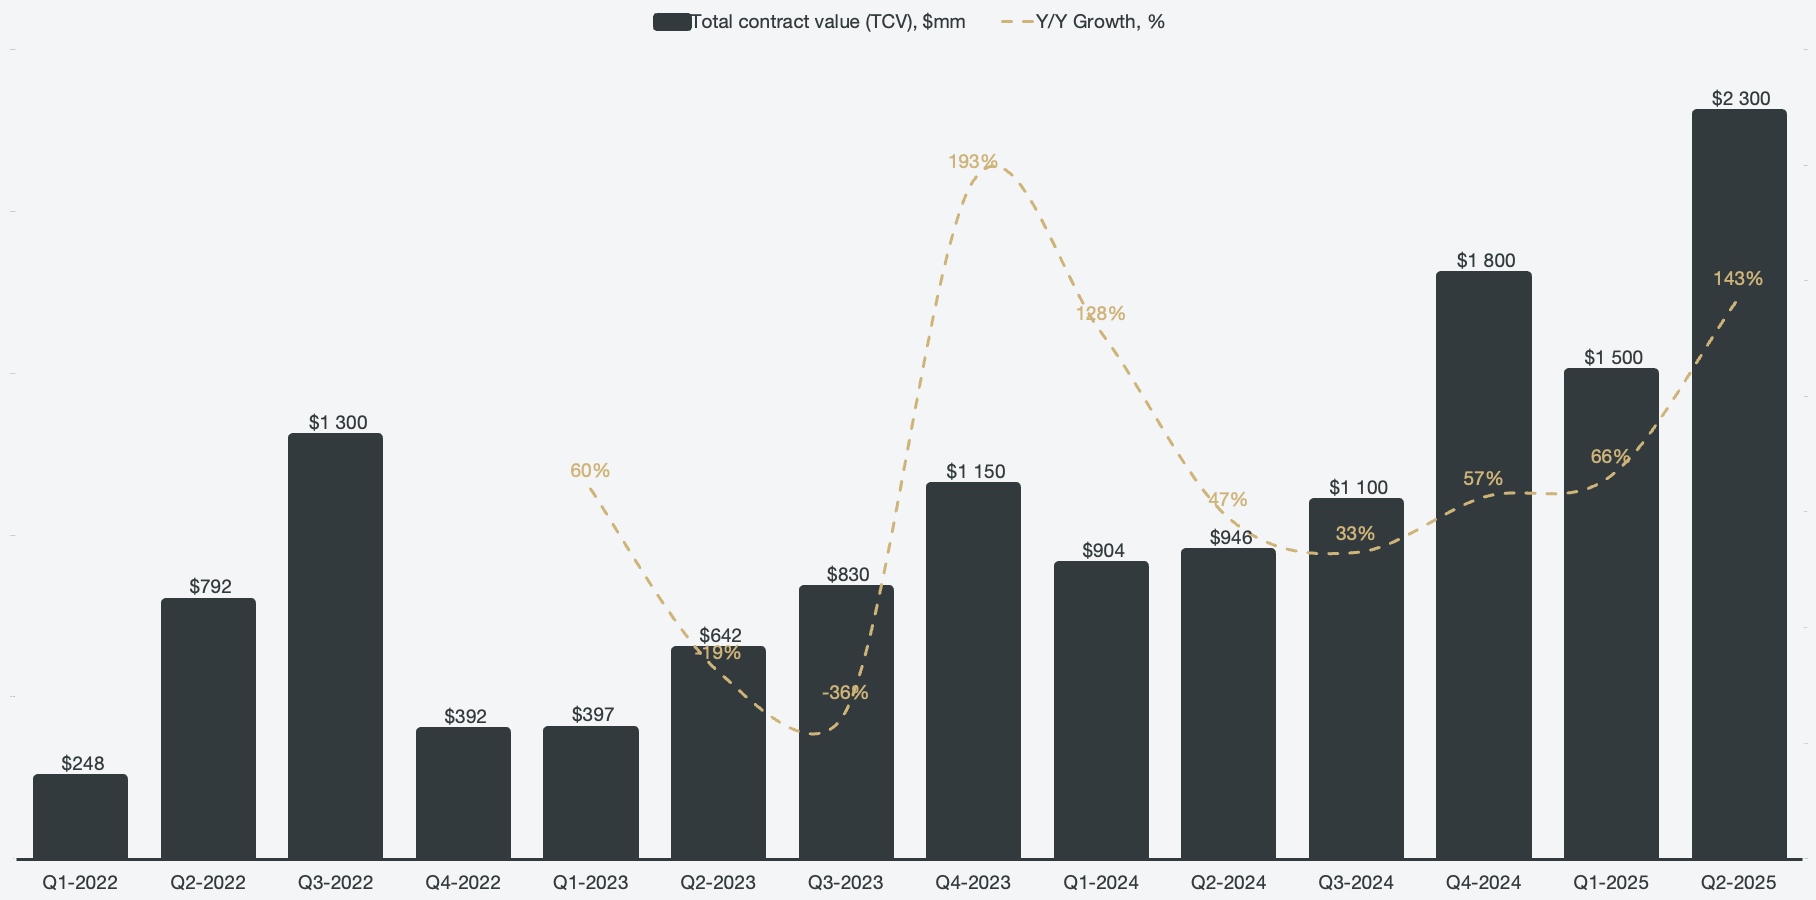
In addition to looking at how current cohorts are scaling, investors can also get a hint of future growth by looking at contract balances. Total contract value, which outlines the total aggregated value of deals closed during the quarter, hit an all-time high in Q2 and grew 143% to reach $2.3 billion.
Figure 9: Total contract value
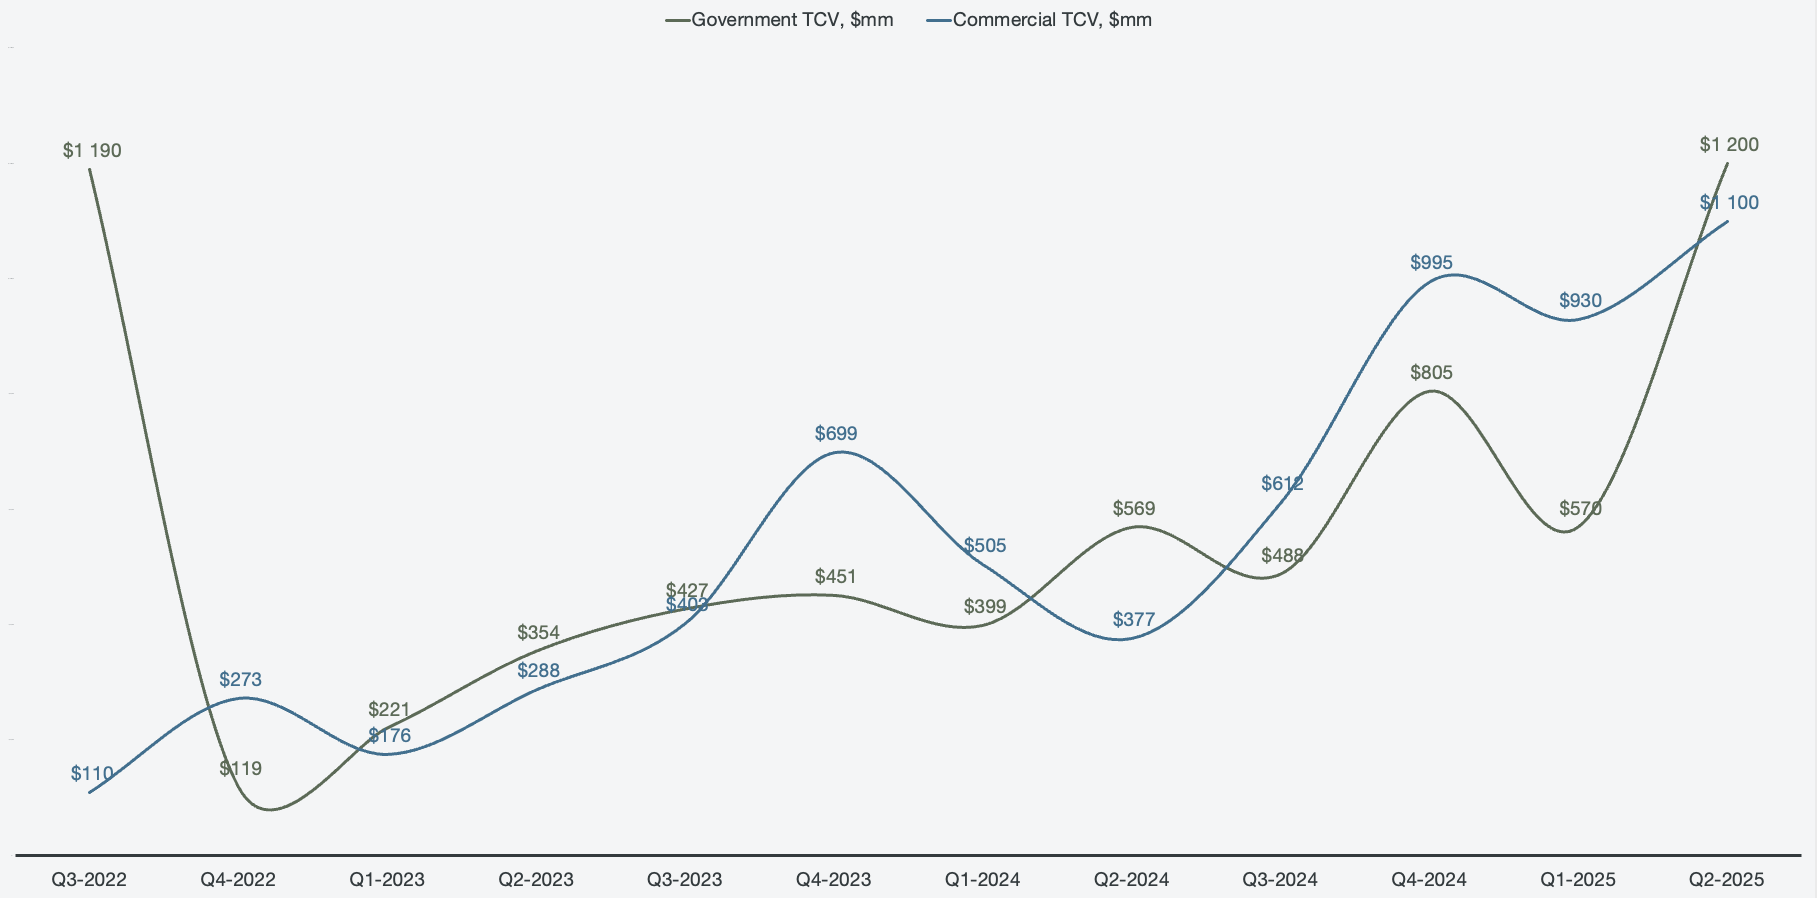
When reviewing the composition of TCV, we can see that both the government and commercial segments are contributing meaningfully, which is what we expect to see. If there was an imbalance, it would have suggested that one half of the business was being left behind. Government is in general more lumpy by nature of procurement, but there is stability in the upwards trend over the past three years.
Figure 10: Segmented total contract value
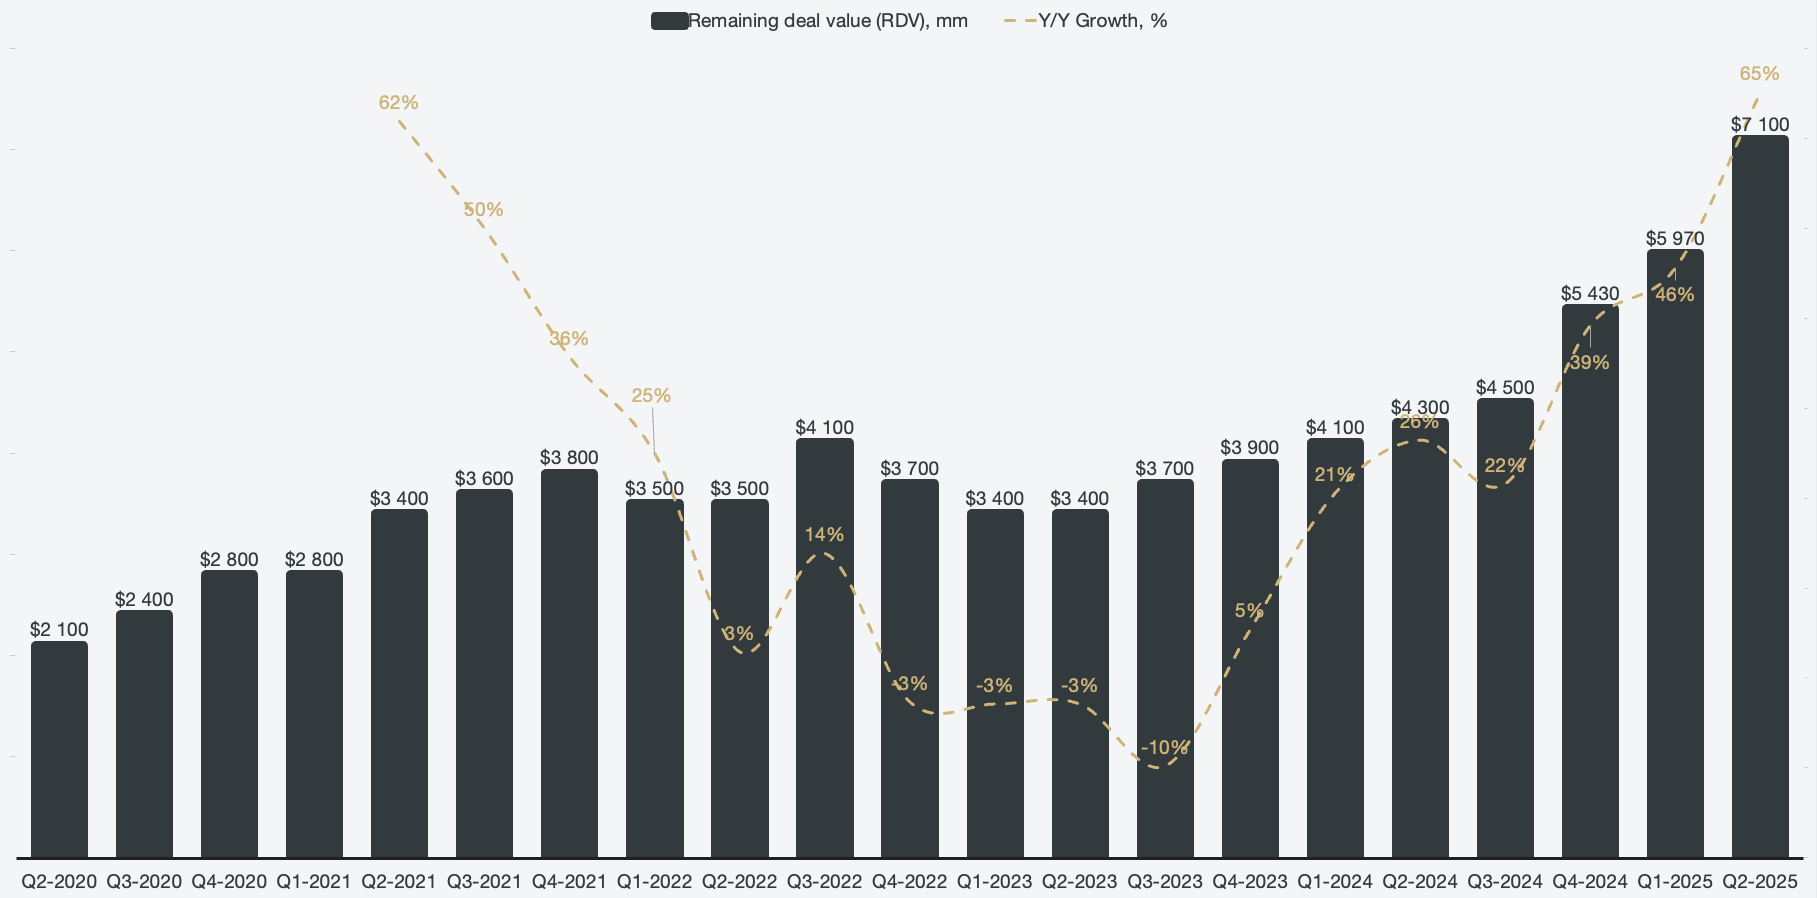
Similarly, remaining deal value, which outlines the total outstanding deal value that Palantir is yet to collect (including options, which are not guaranteed), also hit a new all-time high at $7.1 billion, growing 65% Y/Y.
Figure 11: Remaining deal value
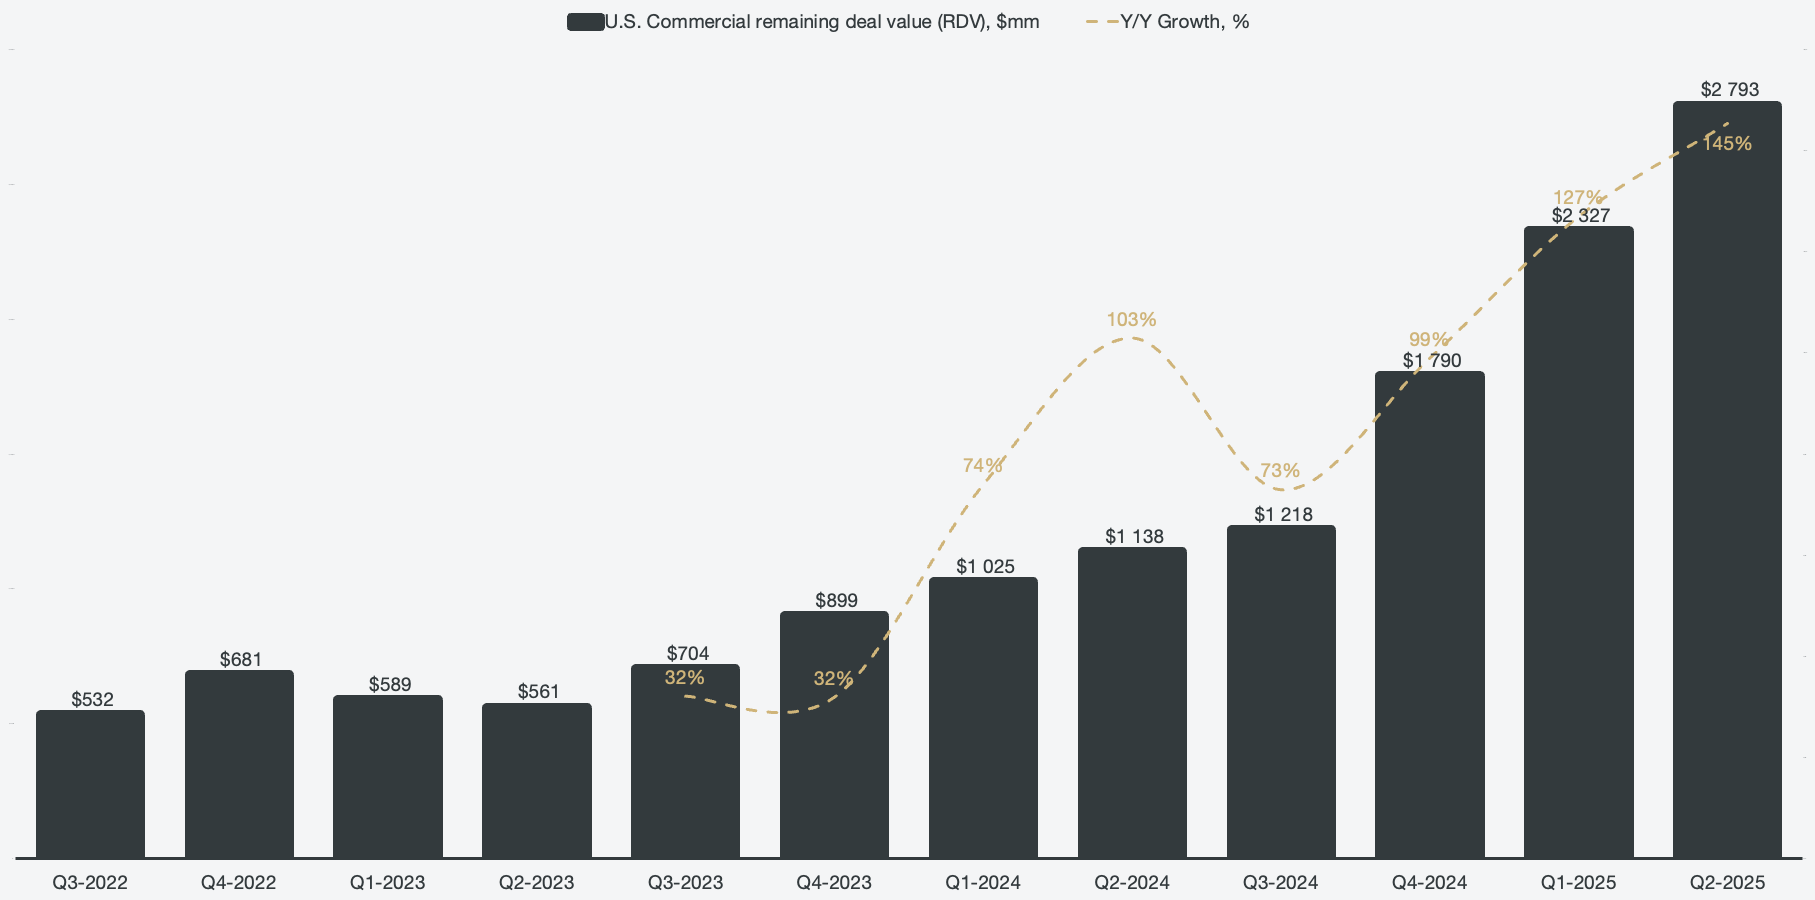
Of the $7.1 billion of total remaining deal value, $2.8 billion came from the U.S. commercial segment, which grew 145% Y/Y. It’s an impressive chart that showcases the sheer acceleration in the U.S. commercial segment, growing at or above ~100% for three quarters in a row.
Figure 12: U.S. Commercial remaining deal value
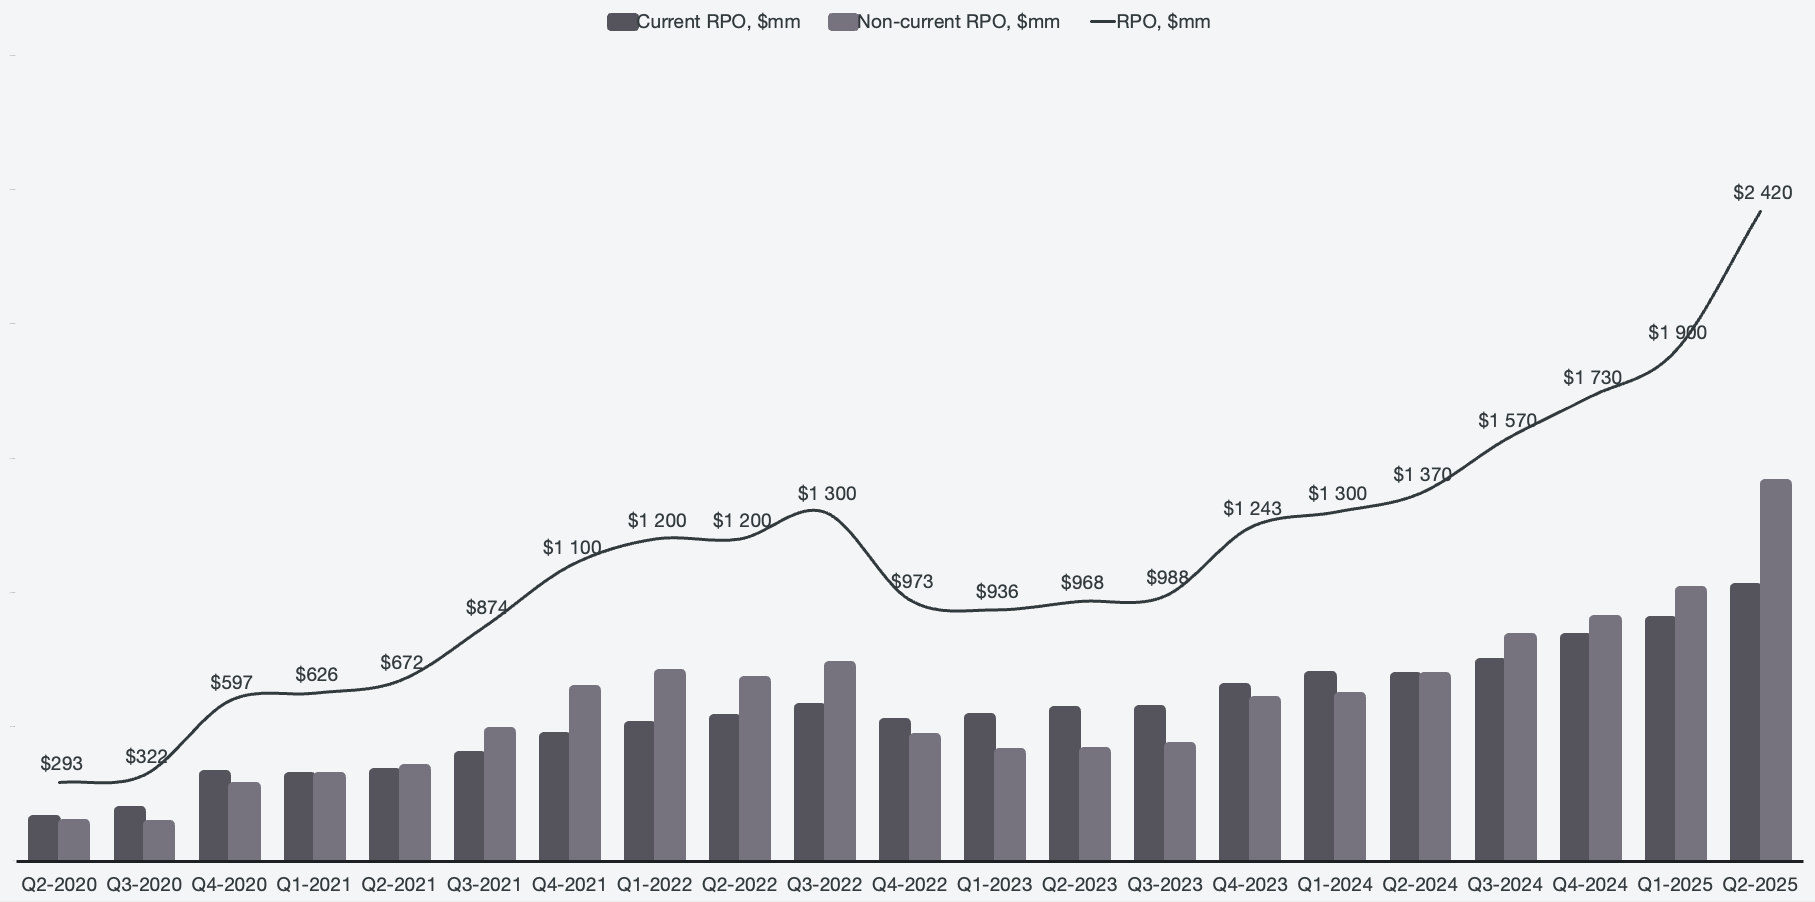
The full dollar amount outlined in the RDV is not guaranteed to be recognized, as it contains options in the contracts that may not be exercised. Remaining performance obligations (RPO), on the other hand, are guaranteed revenue. The caveat is that RPO excludes most government revenue due to the contracts often not having fixed timing and amount of dollar recognition. Therefore, RPO serves as a good glimpse at, and proxy of, the commercial segment specifically. Similarly here, there is a new all-time high hit at $2.42 billion, and it marks two years of consecutive quarterly increases.
Figure 13: Remaining performance obligations
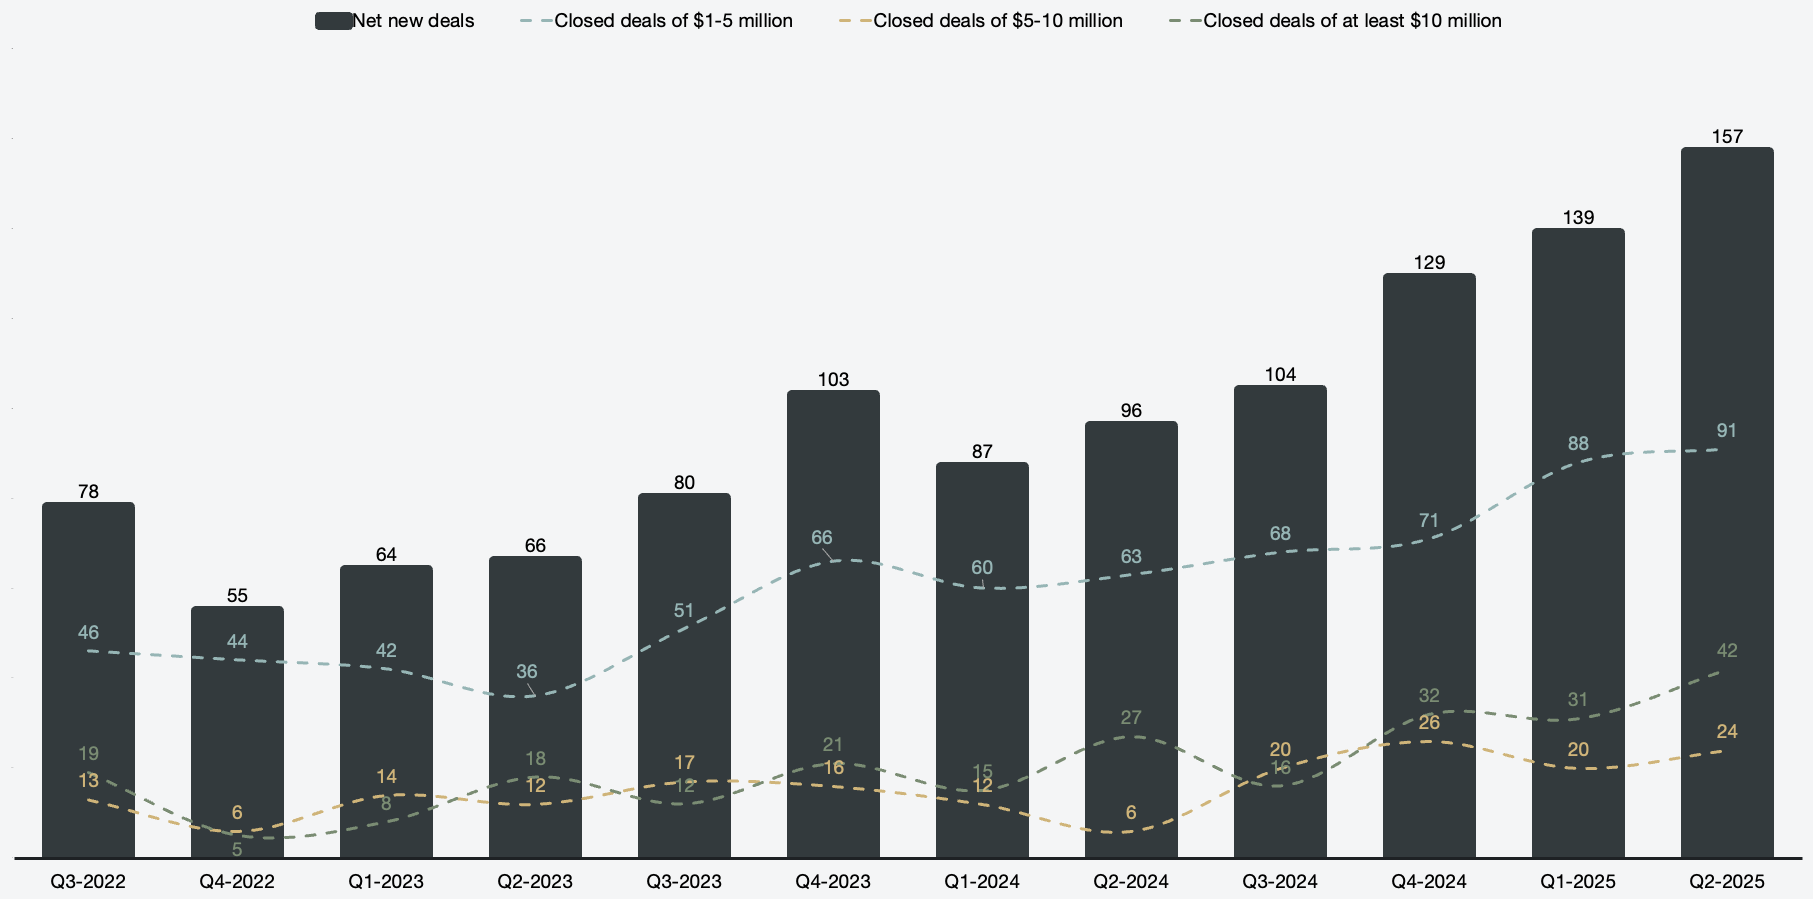
When reviewing the deal's segmented breakdown of $1 million or more, we can see that Palantir hit a new all-time high in the $1-5 million segment. This is further proof that Palantir is increasingly more attractive for smaller businesses. In addition, Palantir signed a record amount of deals of over $10 million and an overall net new deal record high.
Figure 14: Segmented net new deals
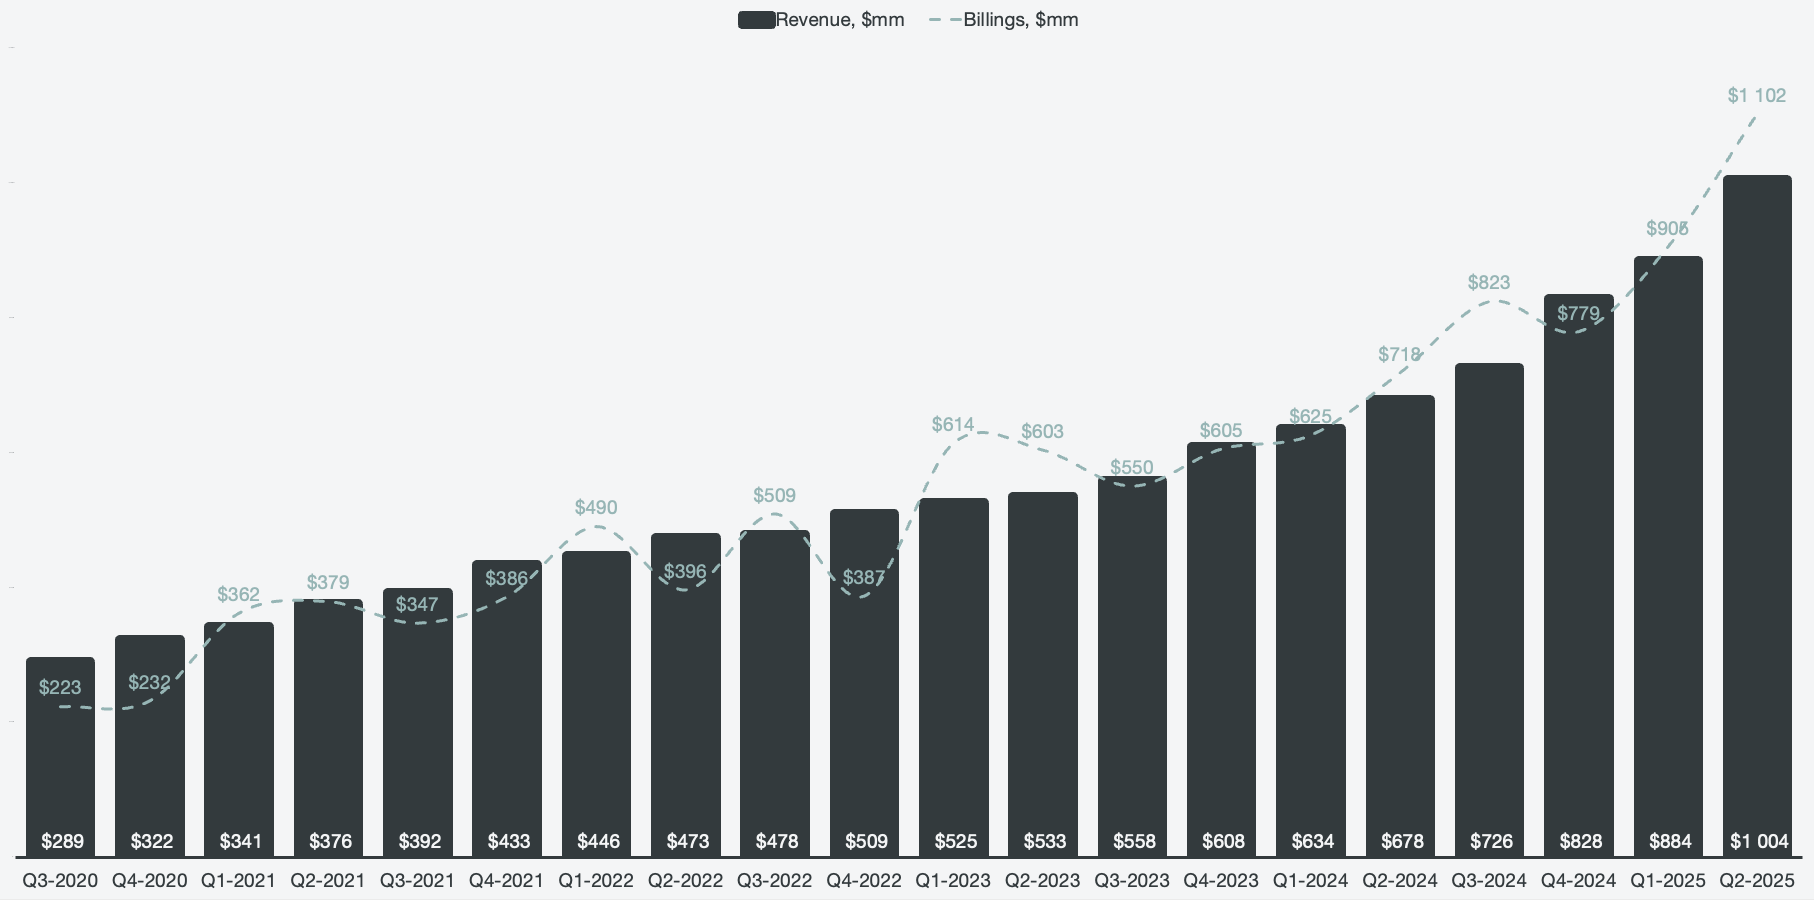
Billings is a metric that helps investors gain a glimpse into future revenue recognition for SaaS businesses. GAAP rules prevent recognizing upfront payments for future services as revenue immediately. Instead, it’s parked as deferred revenue and deposits, to later be recognized as Palantir delivers the service. By looking at billings, we can get a glimpse into future revenue pipelines, as well as demand trends. Billings is defined as:
Billings, too, reached an all-time high and gapped actual revenue by ~$100 million.
Figure 15: Billings against total revenue
By reviewing the contract balances, it is clear that the business is still in an acceleration phase and shows no signs of stopping anytime soon. The future revenue recognition pipelines look sustainable and healthy as per Q2 2025.