

Robinhood Markets: A Disappointing Q1 For The Lazy Investor
Equity research follow-up coverage, rating unchanged

Q1 earnings results were a mixed bag in terms of analyst expectations versus what Robinhood reported. Quarterly results are generally a lot easier to forecast for Robinhood compared to other companies, since they disclose metrics for two out of three months in the quarter. Assuming some key assumptions are relatively stable, being accurate is not an insurmountable task. Once again, that is if key assumptions remain stable, which they weren’t in Robinhood’s case for Q1.
I will do something different in this coverage and attack Robinhood from a bear’s perspective, and still show why Robinhood is severely undervalued as a business.
Company profile
May 18, 2026 Follow-up coverage
Direction: Buy
Previous fair intrinsic value: $158.88, as of February 27, 2026
Symbol: HOOD, Exchange: NASDAQ
Sector: Financial Services, Industry: Capital Markets
Theme: Growth
Fair intrinsic value: $155.29 (101%), as of May 18, 2026
Market capitalization: $70 586 million
Pricing data: P/S 16x, P/E 38x
Previous coverage:

TYPEFCAPITAL.COM
Consider following me on X and YouTube.
This article is for informational purposes only and does not constitute investment advice or an offer to buy or sell securities.
Take-rates explain everything
Most investors forget that cyclical businesses have volatile results until they are reminded of it. And when they are reminded, the stock chart does not look pretty. My forecasting for Robinhood accounts for the business’s cyclical nature, which is why the periods are normalized. I was criticized for expecting 27% Y/Y growth in 2026 when 2025 just posted 52%, almost cutting the subsequent year’s growth in half. That is the result of normalization, and I have done it for all the forecasted fiscal years. Robinhood is the type of business that will post negative growth in transaction-based revenues in one year (2023), and then grow 110% the subsequent year. That is the nature of the business, and as long as investors account for it, seeing near-misses won’t sway emotions.
Instead of starting with the top-line results like usual, let’s begin by looking at the building blocks for getting that top-line. Here is a summary of earnings expectations from Wall Street, and what Robinhood reported:
Total revenue estimates of $1.14 billion, reported $1.07 (-6%).
Net interest revenue estimates of $383 million, reported $359 (-6%).
Transaction-based revenue estimates of $658 million, reported $623 (-5%).
Drilling into transaction-based specifically:
Equities revenue estimates of $83, reported $82 (-1%).
Options revenue estimates of $280 million, reported $260 (-7%).
Cryptocurrencies’ revenue estimates of $153 million, reported $134 (-12%).
Event contracts revenue & other revenue estimates of $122 million, reported $147 (+20%).
How are such large misses possible when Robinhood reports monthly results? The reason is that Robinhood only reports volumes every month; therefore, take-rates can’t be derived.
Equities were basically in line with estimates, which is because equity markets are mature and yields from the volume are pretty stable. There was a relative yield drop of 3% Q/Q, which resulted in a 1% revenue miss. However, in order to capture that 3%, we would have to break out four decimals; that’s how mature equity markets are.
Figure 1: Equities yield
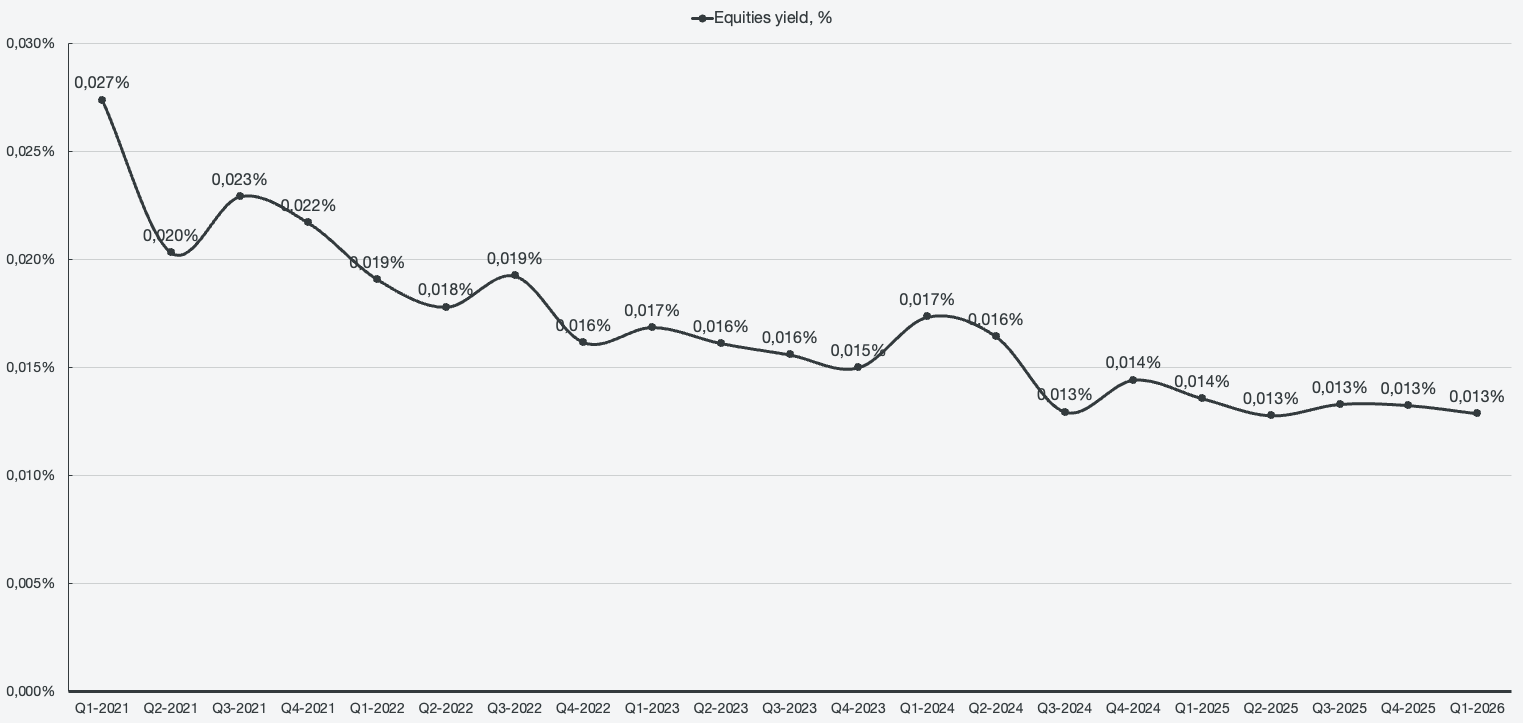
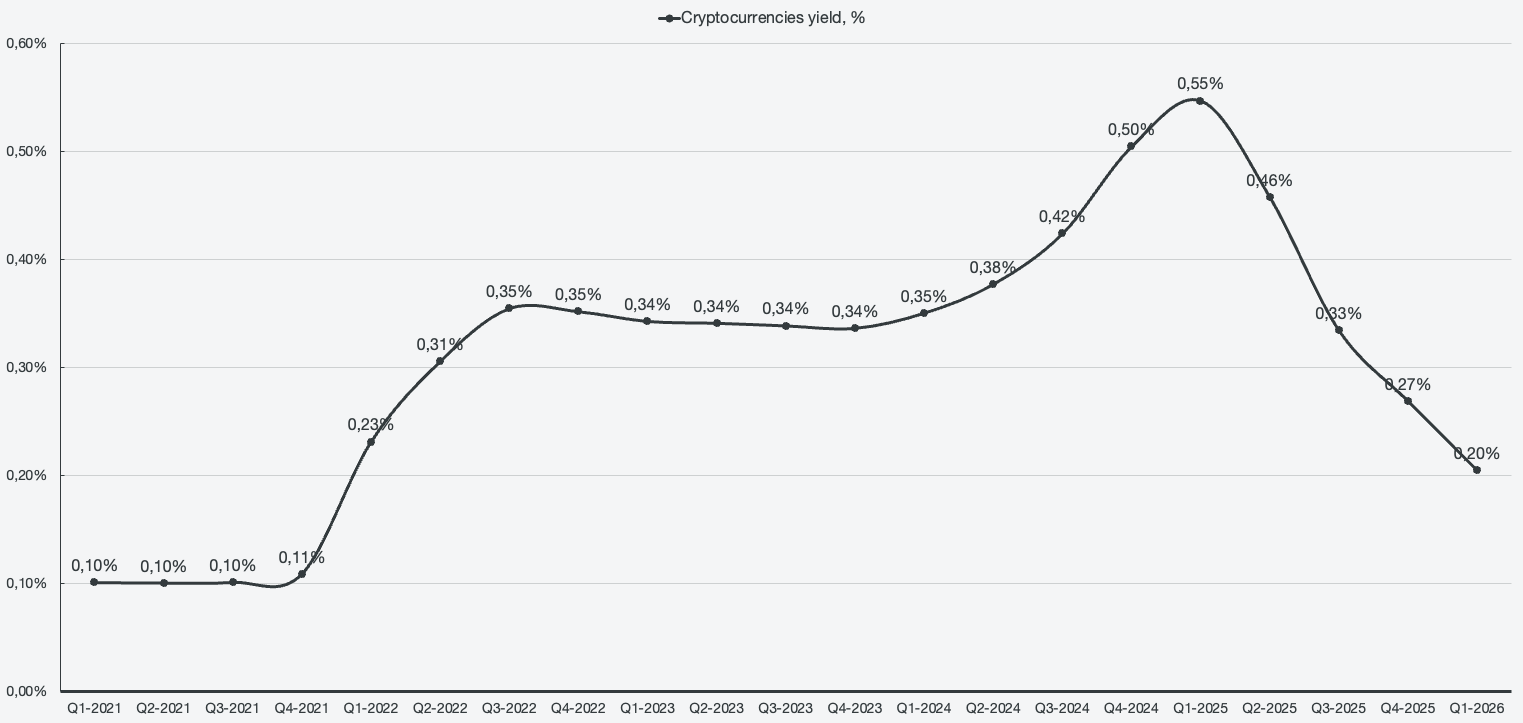
The options yield dropped by 7%, which is also what the miss in options revenue amounted to. On a more drastic note, cryptocurrencies’ yield dropped a substantial amount, by 24% Q/Q. Analysts seem to have accounted for a drop in yield, since crypto revenues missed by 12%, but not enough of a drop. That is because ever since Robinhood introduced Bitstamp, yields have more than halved from the peaks of 0.55% in Q1 2025 and continue to dwindle. The bottom is unpredictable and difficult to forecast, which is likely why the discrepancy from analyst expectations was so big in Q1 2026.
If we apply Q4 2025 yields to Q1 2026 volumes, we would have options revenue in line, equity revenue in line, and a big 15% beat in cryptocurrencies. More importantly, transaction-based revenues would beat analyst expectations.
Figure 2: Cryptocurrency yield
The take rates (yields) were directly addressed by management during the Q1 2026 earnings conference call.
We goal on market share and network winning, and everything that we see is that the case. What happens to take rates is when active traders trade more, take rates naturally go down because we have tiered pricing. This is a good thing.
Shiv Verma, Chief Financial Officer
Robinhood Markets, Q1 2026 Earnings Conference Call
The CFO’s comments make it appear that gaining market share is a good trade-off for the drops in take-rate. In addition, it is implied that there’s more active trading occurring on the platform. However, Robinhood lost market share in three out of four trading segments, only gaining market share in cryptocurrencies, while losing in equities, options, and event contracts.
Figure 3: Trading market share summary
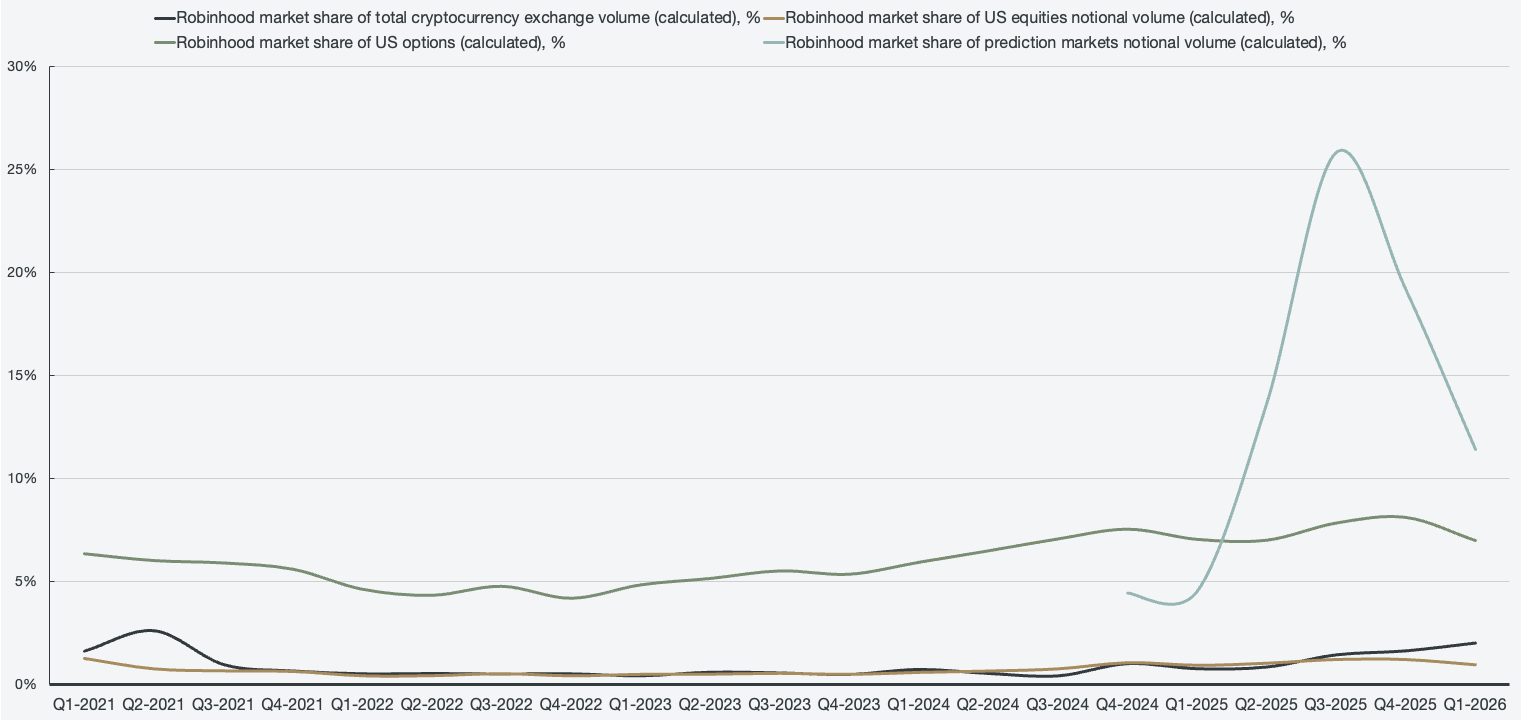
The CFO’s comments also imply more active trading, but the quarter sees fewer cryptocurrency daily active revenue trades (DARTs) Q/Q, fewer equity DARTs, and static options DARTs. When looking at the average trade sizes for cryptocurrencies and equities, it is roughly static compared to Q4. This means that the comments about winning market share and having more active trading on the platform are not supported by the publicly filed data.
Figure 4: Segmented average trade sizes
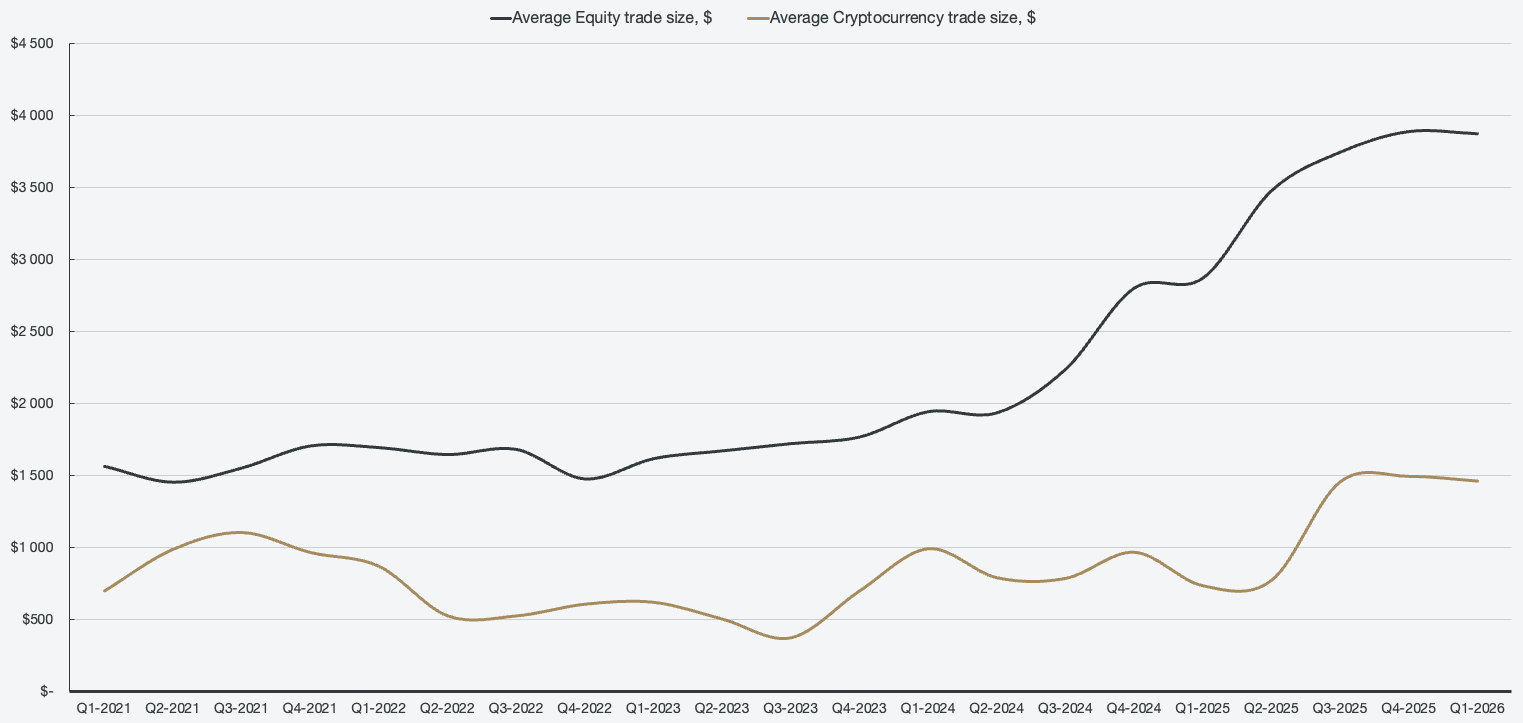
In general, I would agree that take-rates (yields) are a good trade-off in return for sharp gains in market share, but that did not happen this quarter to explain the drops across the board.
Turning to net interest revenue, a similar dynamic can be observed. Monthly data disclosures don’t include broken-out assets so that investors can measure how much of AUC is interest- and fee-bearing, but it does include total AUC. Interest-earning assets as a percentage of total AUC have been roughly the same over the trailing twelve months, both in Q4 2025 and Q1 2026, so analysts would have been more accurate assuming the yield was roughly in line. Both Q3 2025 and Q4 2025 had ~3% in annualized yield on interest-earning assets, a figure that dropped to 2.3% in Q1 2026.
Figure 5: Segmented interest yield
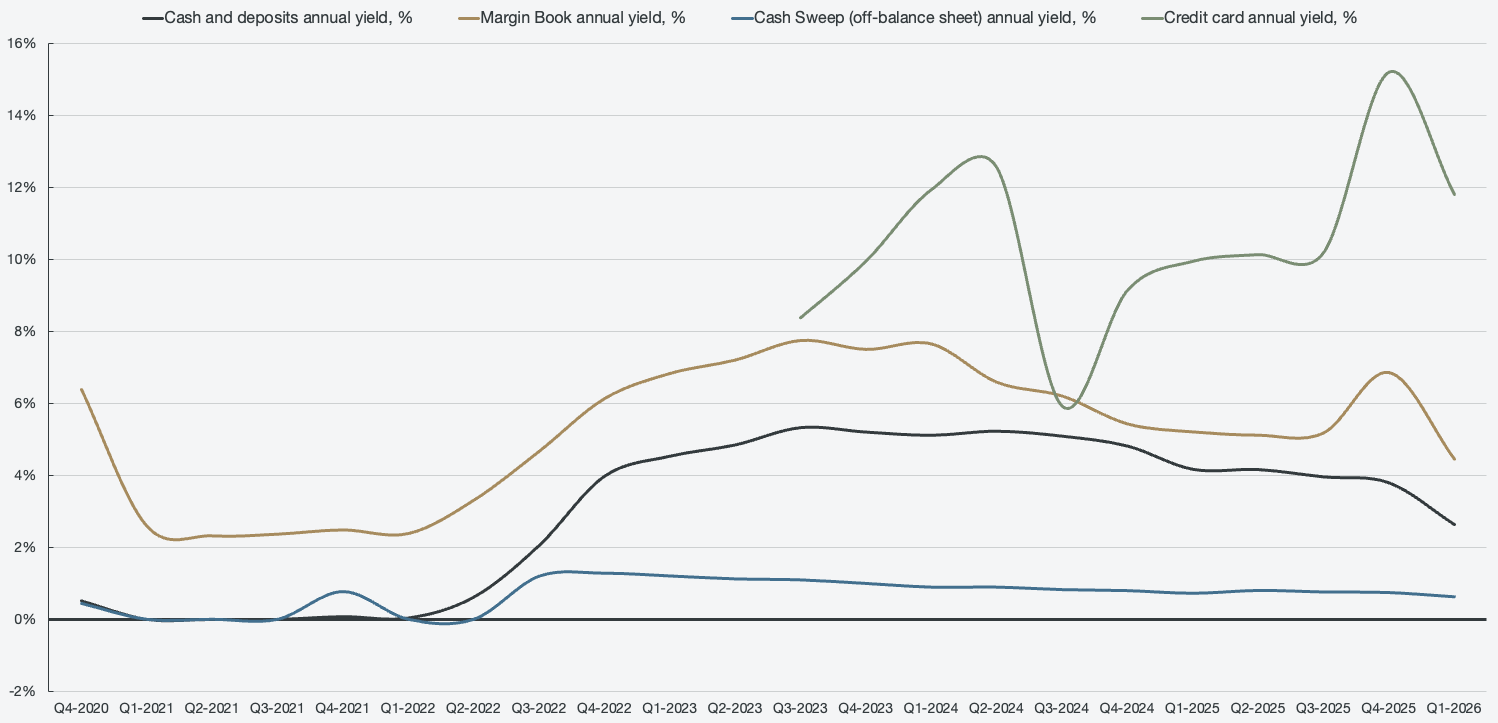
Assuming the same yield on interest-earning assets as in Q3 and Q4 of 2025, Q1 2026 net interest revenues would have come in at $457 million, beating expectations by 20%. Summing up transaction-based revenues and net interest revenues based on Q4 yields would have left Robinhood beating earnings expectations by 5% on total revenue.