

S&P Global: Dominant And Unfair
Equity research follow-up coverage, rating unchanged

My previous coverage detailed S&P Global’s segments and what makes it one of the highest-quality businesses in the world. Q3 was solid, and more importantly, the investor day presentation held in November outlined an even brighter outlook than I had initially envisioned.
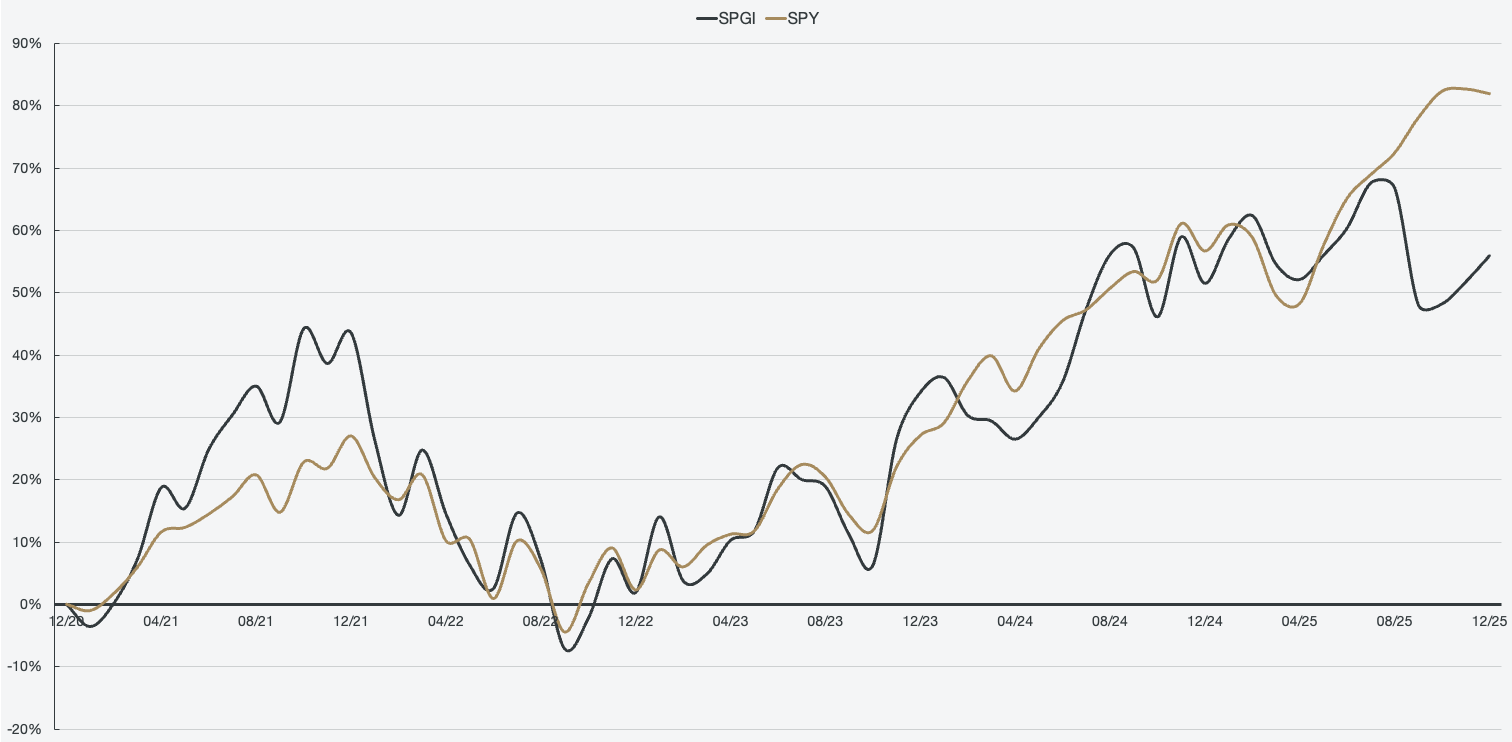
However, I received an interesting comment from a subscriber, stating that SPGI 0.00%↑ has only performed on par with SPY 0.00%↑ over the past 5-year period. My reply was, “Why would it have outperformed when S&P Global operated at the bottom of the cycle?”
Price chart 1: SPGI and SPY, 5-year stock quote, USD per share
Company profile
21 December, 2025 Follow-up coverage
Direction: Buy
Previous fair intrinsic value: $634.80, as of August 30, 2025
Symbol: SPGI, Exchange: NYSE
Sector: Financials, Industry: Financial Data, Stock Exchanges
Theme: High quality
Fair intrinsic value: $720.80 (40.62%), as of December 21, 2025
Market capitalization: $156 086 million
Pricing data: P/S 10x, P/E 37x
Previous coverage:

TYPEFCAPITAL.COM
Consider following me on X and YouTube.
This article is for informational purposes only and does not constitute investment advice or an offer to buy or sell securities.
S&P Global is making their business even more unfair
Q3 saw overall revenues accelerate even further, with margin expansions across every segment. Overall, total revenues grew 9% Y/Y, which is not the most exciting, but it signals an acceleration from 6% the prior quarter. Also, as can be seen in the overall trajectory, the trend is upwards; this is what signals a quality compounder. The ability to accelerate regardless of where the business is in its cyclical stage is impressive. In fact, over the past 10 years on a TTM basis, the company has grown every single quarter at 11.25% CAGR.
Figure 1: Segmented revenues

The investor day presentation also detailed several secular tailwinds, which will create opportunities for further growth. These will be discussed in detail per segment, but for the company as a whole, S&P Global outlined a 7-9% organic growth target over the next 3-5 years. That may not sound impressive, but the key highlight here is “organic,” meaning growing their current business. I believe that most of their segments will outperform management’s forecast, as there are several durable advantages inherent to the business, also outlined by management.
S&P Global’s overall market leadership is exemplified by over a century of built-up credibility and trust. S&P Global’s reputation for rigor, accuracy, and objectivity is a moat in and of itself. S&P Global indices, credit ratings, and commodity prices power whole ecosystems. In addition, the breadth and depth of data are highly differentiated.
Over 95% of S&P Global’s revenue is derived from proprietary data, processes, and tools, protected by IP. Only as-reported financials, transcripts, press releases, and various SEC filings are undifferentiated, making up less than 5% of the revenue. 63% is from benchmarks, a more or less irreplaceable segment containing the ratings, indices, and commodities. 15% is made up of proprietary and curated data. The next 13% comes from workflow tools, including Capital IQ, which is a competitor to the Bloomberg Terminal, FactSet, and Refinitiv. 5% is from services and events, such as consulting and advisory services.
In addition to the advantages, there are also secular tailwinds that will create opportunities for S&P Global to target high-quality growth across its segments. These include many of the tailwinds I detailed in my previous report, such as the debt maturity wall causing ~$12.4 trillion in refinancing demand over the coming years. In addition, we are seeing increased capital markets activity such as M&A and IPOs, as well as trading volumes. There are also emerging markets showing a lot of strength, as well as private markets. Not to mention the outsized demand for energy expansion and infrastructure, which will require a lot of capital.
There are some factors that serve as disruptions but can also be seen as tailwinds, such as generative AI and agentic accelerations across most segments. This can cause a shift from S&P Global’s products, but since the company deploys their own solutions in the space, it can also be seen as a positive.
The only real tangible downside in recent trends is the fee compression seen at passive managers, which inherently impacts the indices segment. However, the segment as a whole is thriving, seeing ~250% growth over the past decade.
Q3 acceleration and further growth across segments
The investor day presentation details the growth opportunities across all of its segments. I am personally the most bullish on ratings and indices, the two most robust and durable segments with significant barriers to entry. As mentioned in my first report, these segments also boast outstanding margin profiles.
Figure 2: Ratings revenue and operating margin

The reacceleration is in effect, and it is only going to continue as the periods compound. Over the next 3 years, there is $8.2 trillion in debt maturing, which is roughly 26% above the historical average. Global debt outstanding is increasing, and so is GDP. Private market activity is picking up, and S&P Global is well positioned to capture that demand. S&P Global has steadily held a >70% market share of the global debt market, and I expect that to continue to be the case, as there is no evidence of a deterioration in credibility.
M&A activity, infrastructure investment, capital markets development outside of the U.S., and new asset classes are all ripe for the taking. There has been demand for credit ratings of data centers, crypto, and other emerging assets, in addition to decentralized finance ecosystems, stablecoins, and tokenization.
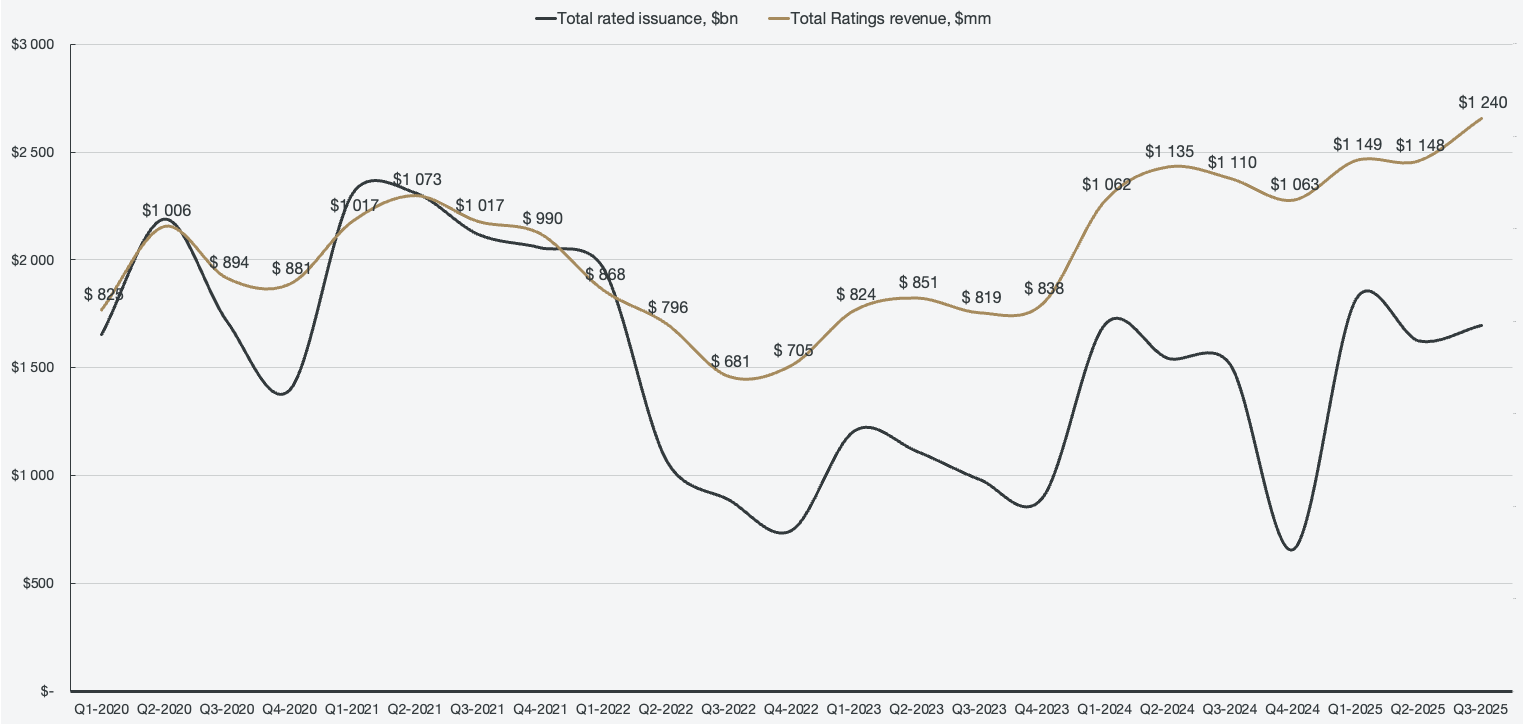
S&P Global guides 6-9% organic growth for the segment over the next 3-5 years, but I believe that it will be significantly stronger off of M&A and the debt maturity wall alone, since rated issuance and ratings revenue are intertwined. Over a 10-year period, I see ~15% CAGR as S&P Global rides the tailwinds of this cycle.
Figure 3: Rated issuance and ratings revenue correlation
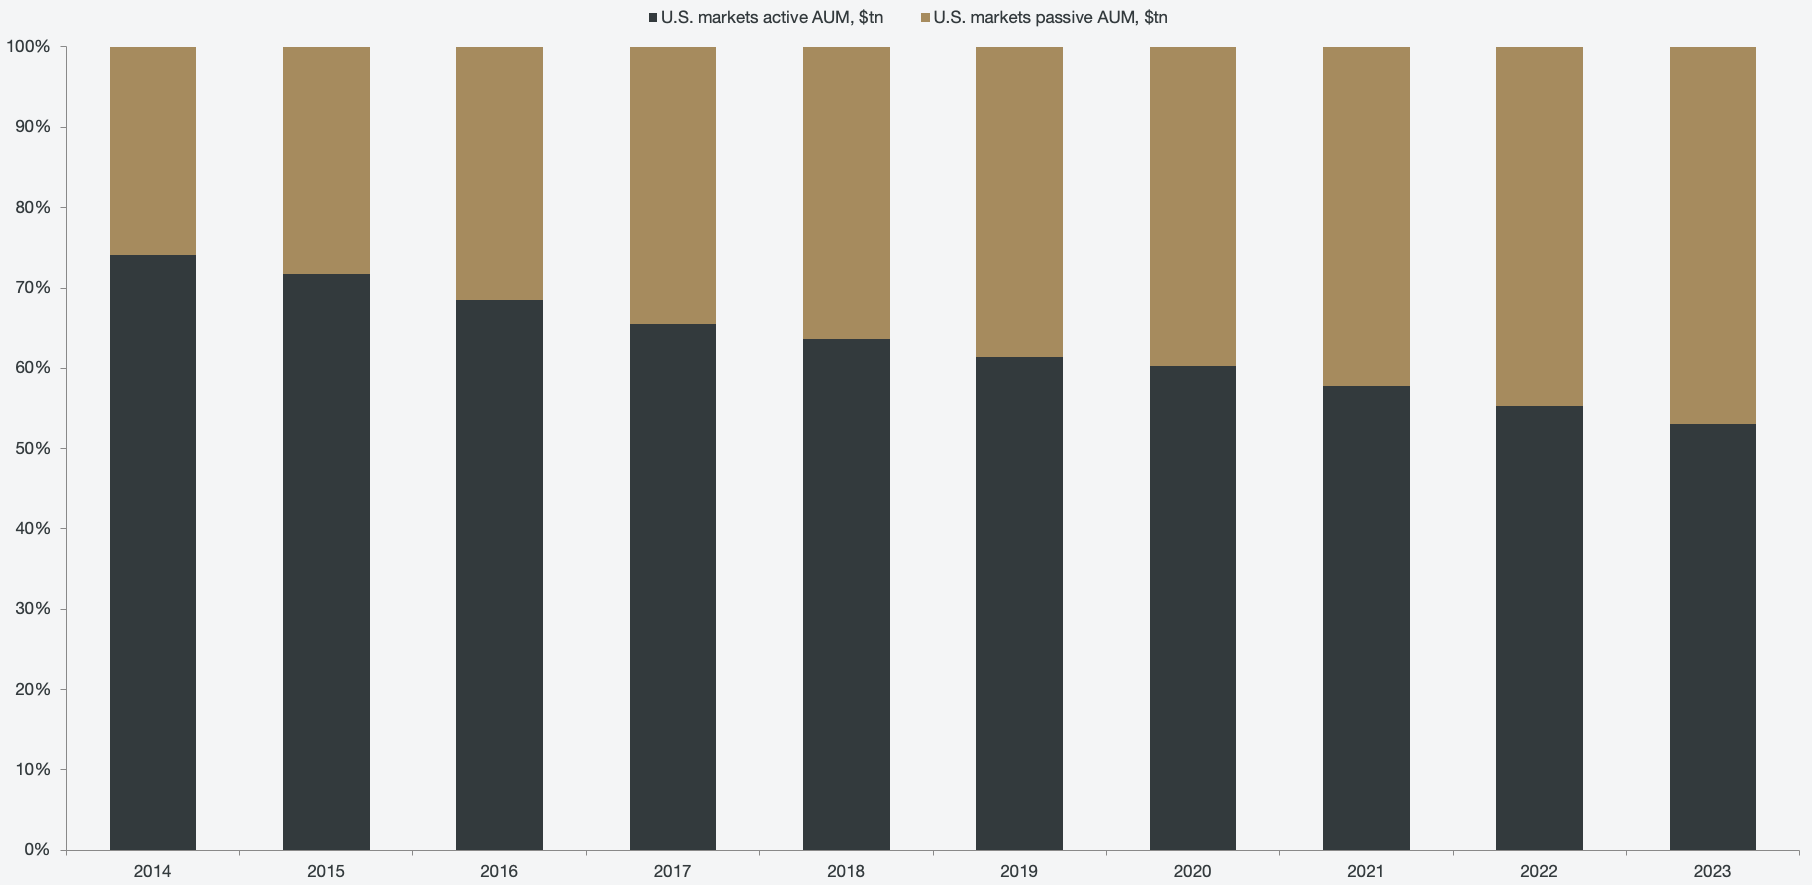
The segment that management expects the most growth from is the indices, which they forecast to grow between 10% and 12% over the next 3-5 years. This segment is also the most profitable, with around ~70% operating margins (compared to ~60% of ratings). Widely regarded as the main index for benchmarking the market, S&P Global owns the S&P 500 (and derivatives), and the overall passive investment style is growing increasingly more in favor. In 2023, passive AUM surpassed active AUM for the first time in history.
Figure 4: U.S. active vs. passive AUM
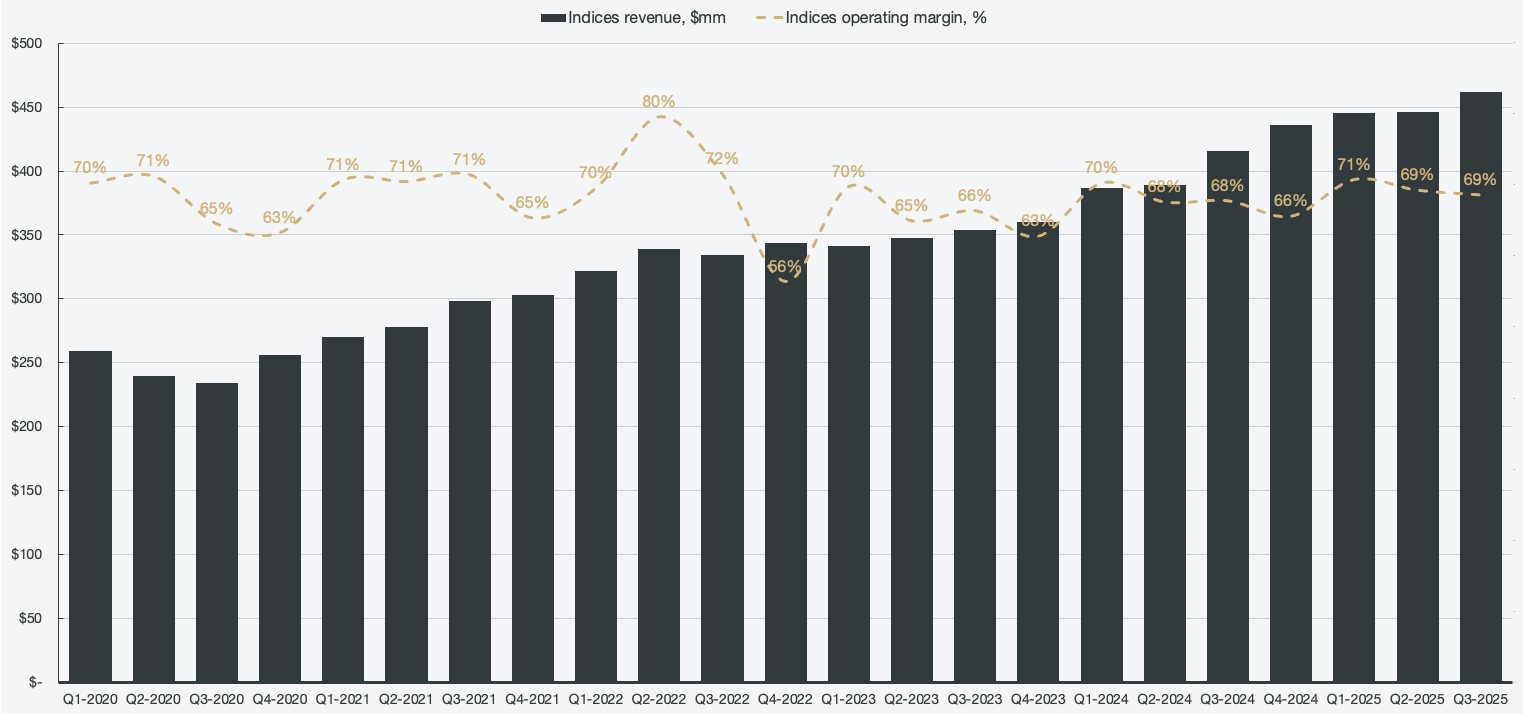
The overall growth drivers include expansion of private market investment opportunities, alternative asset classes (and digital assets), and the continued globalization of passive indexing. To date, there are $27.7 trillion in assets indexed or benchmarked to all S&P Dow Jones Indices, and it has grown at a 10% CAGR since 2020. This includes products derived from the S&P 500, such as the VIX, various sectors, dividends, and factors. It also includes products linked to the S&P 500, such as ETF options, futures, equity options, and leveraged ETPs.
Figure 5: Indices revenue and operating margin
The segment that faces the most competition and that I have seen as consistently the weakest is the Market Intelligence segment. In essence, the segment provides the deepest and most comprehensive proprietary data and tools in the market, but the collection of data and insights is fragmented. It has essentially been assembled from a composition of products, services, workflows, and software tools. This was highlighted as a focus point during the investor day presentation, and much of the margin expansion that will happen across segments will be derived from the Market Intelligence segment.
Figure 6: Market Intelligence revenue and operating margin
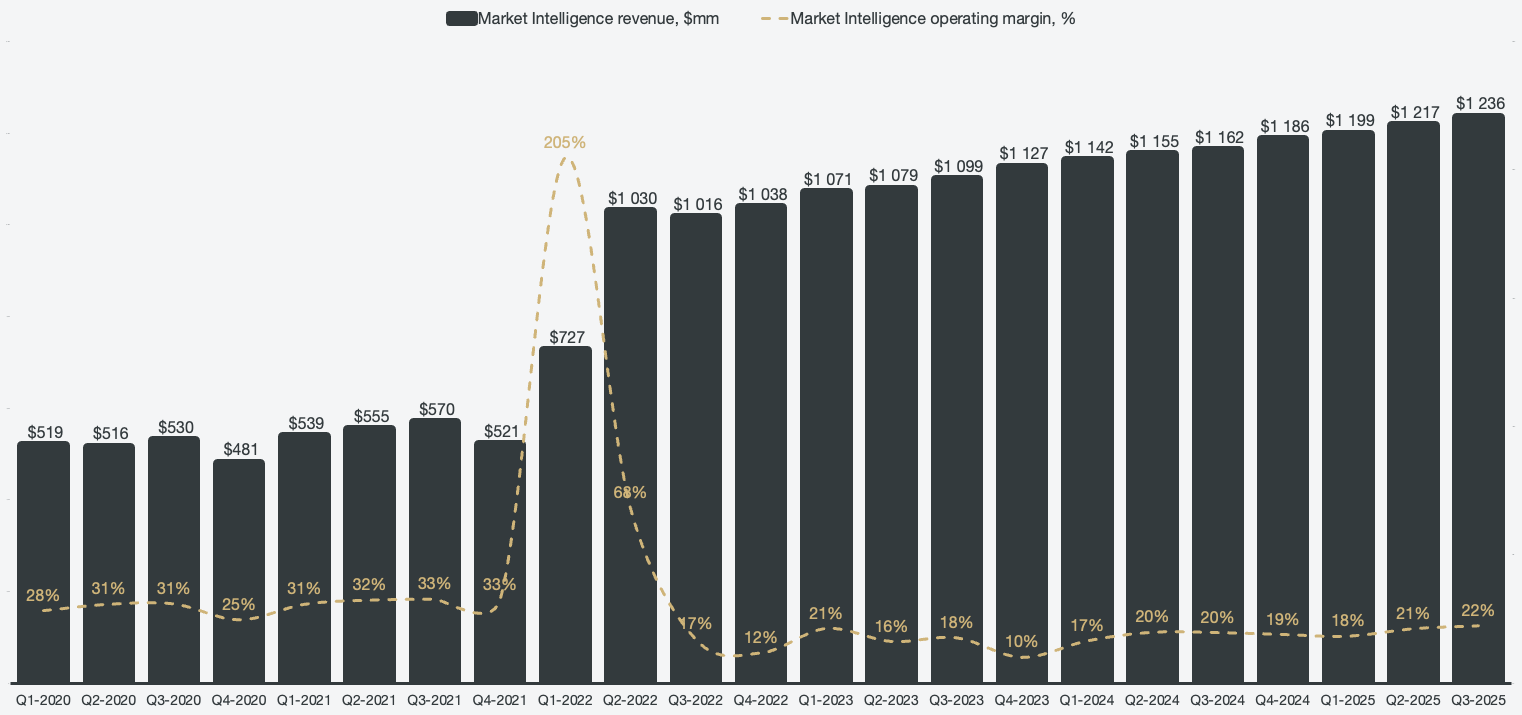
There are a lot of vendors for market data, including key competitors like the Bloomberg terminal, Refinitiv, and FactSet. However, customers want to consolidate, and the data that S&P Global has is differentiated, as mentioned before. Creating fit-for-purpose workflow tools, seamless deployment of AI across product suites, and leveraging the sheer extensive range of products and services. By streamlining the offering, the product segment becomes more profitable, and by extension, more attractive to customers. Management only expects it to grow between 6% and 8% over the coming 3-5 years but sees it as a core segment for margin expansion.
The last detailed segment now that Mobility is being spun out is Energy, formerly known as Commodity Insights. It is a segment very similar to market intelligence, but for commodities. The reason for the name change was mentioned to be due to commodities essentially being energy, but I suspect that they are simply riding the global energy demand trend.
Energy benchmarks and assesses over 15,000 prices daily across over 150 different countries. It covers 100% of the global energy and commodity market, with over 2,000 researchers, price reporters, and industry experts working in the segment. The growth drivers are detailed to be an increased demand for more advanced technologies across customer-facing solutions. In addition, there is an expansion and evolution of the global energy ecosystem, with a diversification of energy sources that needs benchmarking. There is also ongoing product innovation and benchmark expansion to capture emerging commodity classes, as well as penetration in the financial services end market.
Figure 7: Energy revenue and operating margin
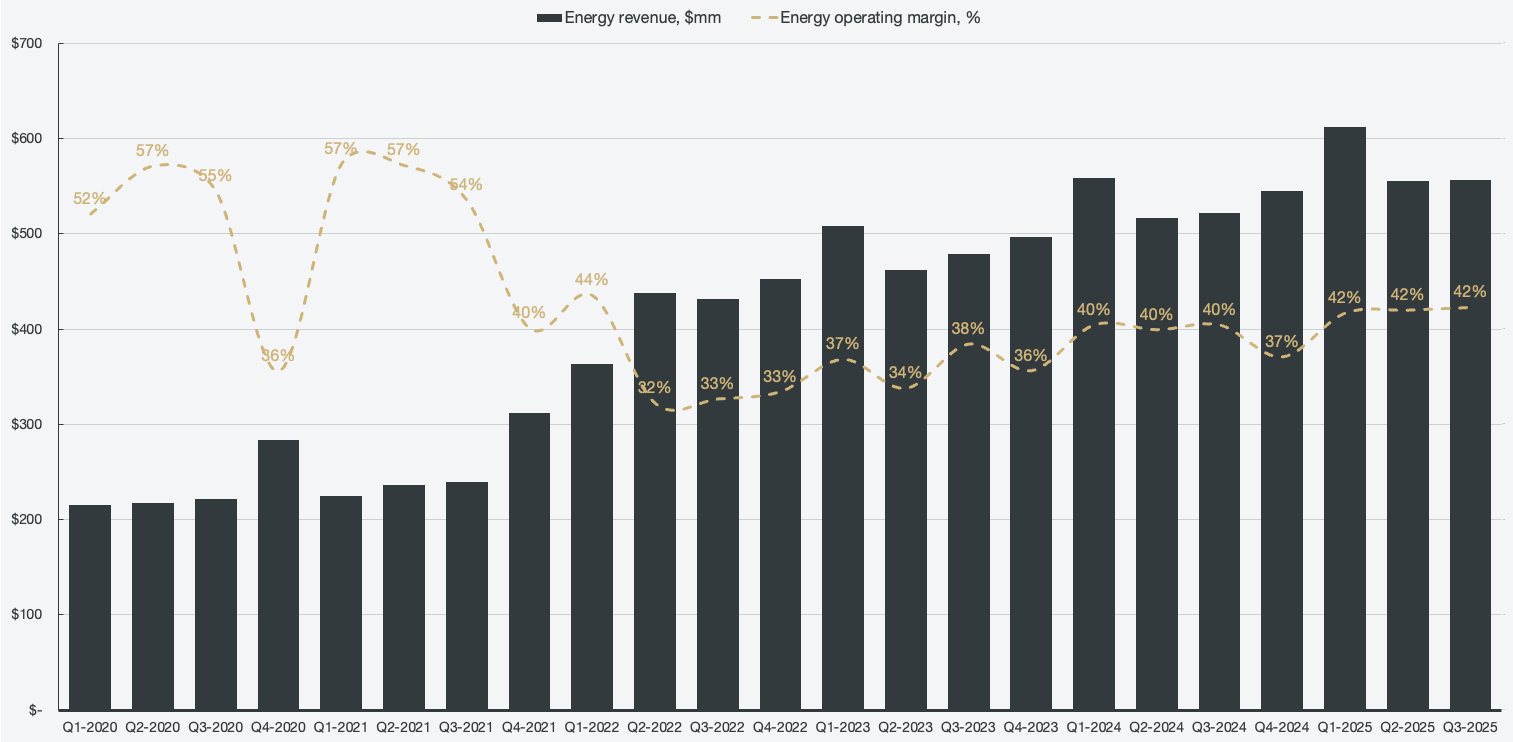
I was previously relatively unexcited about the segment. It had market dominance, but it was not an exciting market. Now that new products and benchmarks are being created in addition to new asset classes, this segment could be perfectly aligned to capture alongside the global energy demand driven by AI. Energy is expected to grow in line with the marketing intelligence segment on an organic basis.