

S&P Global: This Fortress Has A $12.4 Trillion Opportunity
Initiating equity research coverage

It is rare to encounter a business that operates an exceptional business segment that boasts ~60% operating margins. S&P Global operates several such segments. Not only does S&P Global have multiple operating segments with over 60% operating margins, but the segments are also expected to grow at a compounded annual growth rate of ~15% over the next 10 years.
S&P Global is one of the highest-quality businesses in the world, and it is rare to be able to purchase stock below fair intrinsic value. However, the market is currently discounting one of the largest opportunities for the company. There is a wall of corporate debt maturing for the remainder of the decade, which will inherently boost the most important business segment: credit ratings. In addition, M&A activity is set to pick up, bolstering a prosperous period for the ratings segment.
Company profile
31 August, 2025 Initiated coverage
Direction: Buy
Previous fair intrinsic value: N/A, as of N/A
Symbol: SPGI, Exchange: NYSE
Sector: Financials, Industry: Financial Data, Stock Exchanges
Theme: High quality
Fair intrinsic value: $634.80 (16%), as of August 30, 2025
Market capitalization: $167 823 million
Pricing data: P/S 11x, P/E 42x
TYPEFCAPITAL.COM
Consider following me on X and YouTube.
This article is for informational purposes only and does not constitute investment advice or an offer to buy or sell securities.
As discussed in the FICO equity research piece, the credit ratings business borders on being unfair for the companies that hold monopolies within it.

S&P Global currently has 5 operating segments, each with distinct opportunities over the coming years. However, the largest opportunity resides within the ratings segment, which is also the most important and robust business segment.
Figure 1: Segmented revenue

There are many ways to assess a high-quality business, including pricing power, profit margins, growth, market share, and sustainability. However, one quality that is often overlooked is predictability. Prior to the FY2024 results being announced, I wrote a public Seeking Alpha article where I outlined my estimates for the year. The estimates were on a granular level, mapping out revenue and operating income for each segment. The company not only met my own estimates but also outperformed across most segments and measures.
Figure 2: Type-F Capital estimates for S&P Global FY2024 segmented results

$12.4 trillion of opportunity
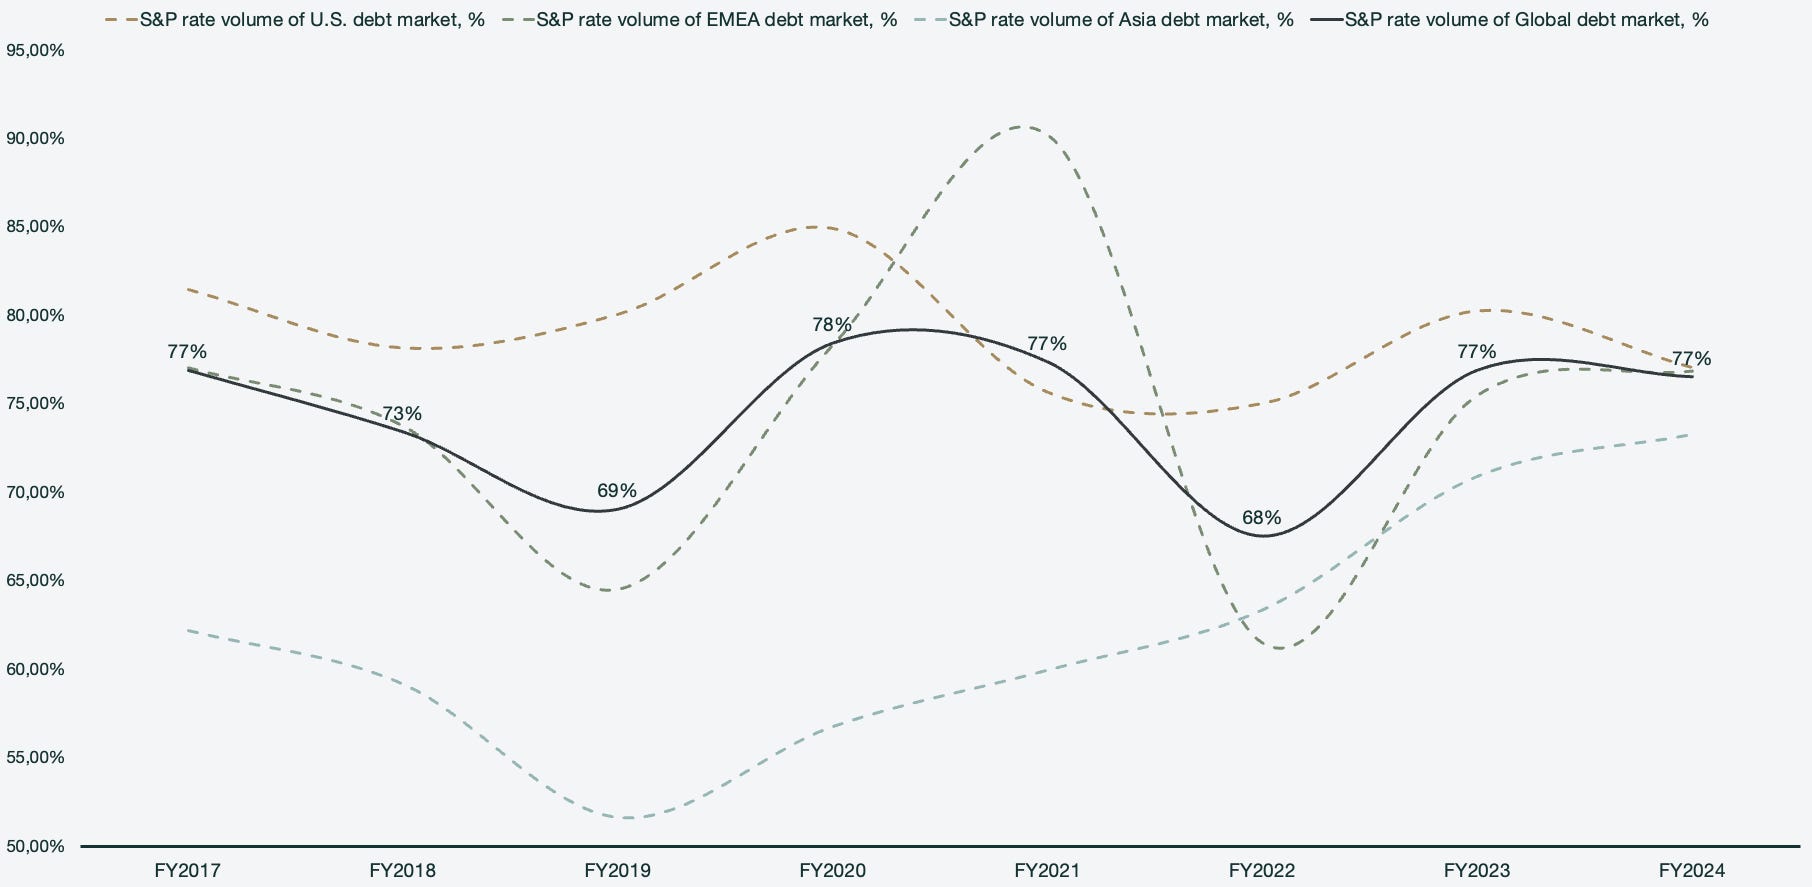
S&P Global’s rating segment currently accounts for ~30% of total revenues, a figure that I forecast will grow to ~40% of total revenues by 2034. S&P Global currently rates 77% of global debt, with a strong presence across the U.S., EMEA, and Asia.
Credit ratings are inherently cyclical, as they rely on debt markets. There are many different drivers for credit issuance, including distress, prosperity, expansion, growth, and decline. Credit is synonymous with most stages of the economy. During distress, struggling entities seek to refinance or raise capital for turnaround efforts. During prosperity, companies leverage favorable conditions to expand. In addition to the debt maturity wall, there are more tailwinds for the ratings business. For example, the M&A activity has remained somewhat cold in recent periods but is starting to pick up and serves as yet another source of ratings volume.
However, the last couple of years have seen a decline in credit issuance due to a variety of reasons, primarily high interest rates aimed at combating inflation post-pandemic. This followed a period of low interest rates when many businesses had already taken on significant debt under more favorable conditions, leading to a saturation of corporate borrowing.
Figure 3: Rated share of debt markets
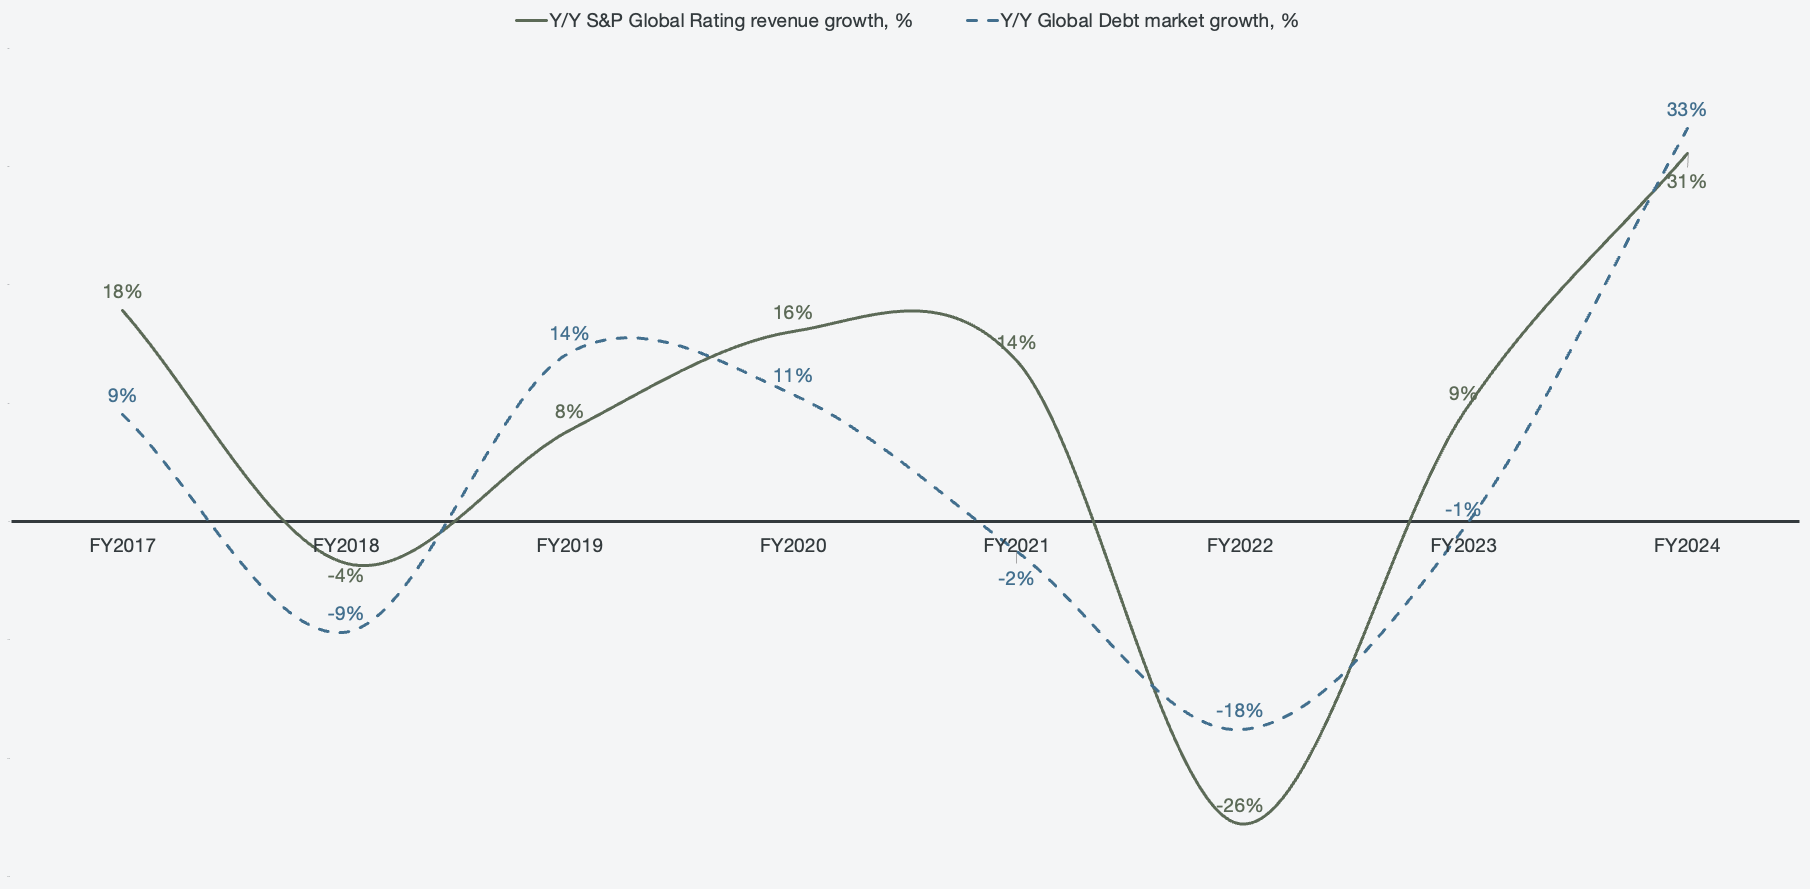
When mapping out the debt market growth against S&P Global’s ratings revenue growth, the correlation becomes more obvious. Dev Kantesaria of Valley Forge Capital often likens the credit rating industry to a toll booth on a bridge. Every vehicle needs to pass the bridge and pay the toll, but when they decide to cross isn’t always known.
Figure 4: S&P Global rating revenue growth correlation with global debt growth
However, what if investors actually can estimate when the bridge is about to be crossed? In fact, we do have an indication of when corporate debt will mature. The global maturity schedule estimates indicate that fiscal years 2025-2029 will see $12.4 trillion in maturities. The debt includes bonds, loans, and revolving credit facilities that are rated by S&P Global. The debt maturity wall sets the bed for solid ratings revenue for the remainder of the decade.
Figure 5: S&P Global estimated global corporate debt maturity

In addition to the debt maturity wall, there are more tailwinds for the ratings business. For example, the M&A activity have remained somewhat cold in recent periods, but is starting to pick up, and serves as yet another source of ratings volume.
Figure 6: M&A volumes and deal values

We have also seen IPO activity increase during 2025 after a substantially calm period. All of these factors combine into what I believe will be an exceptionally prosperous period for the ratings business segment for the remainder of the decade.
Unfair business segments
The ratings segment is robust because of how reliant banks, countries, governments, financial institutions, insurance companies, and many other entities are on S&P Global’s credit ratings, credit research, and credit analytical services. Despite the cyclicality associated with the segment, ratings still perform well during down years and generate a substantial amount of cash for the company.
There are some measures built into the segment to combat volatile periods. Transactional revenues associated with debt market activity thrive during favorable conditions, for example, when there is a lot of M&A and IPO activity. However, when markets are cold, there are still services that are delivered over time, and these remain stable and provide a solid backbone to the business segment. This reinforces the sheer robustness of S&P Global’s ratings business.
Figure 7: Ratings services mix distribution
