

My 115% CAGR Portfolio Heading Into 2026
Investment philosophy and individual positions

Those of you who are paid subscribers have been able to track my buys and sells in near real-time through this Substack. However, this post marks the first time I publicly reveal my current portfolio and the thesis behind each position.
My personal investment philosophy revolves around buying the highest quality companies at or below fair intrinsic value. Most of my time is spent identifying companies with significant barriers to entry, wide moats, exceptional margins, and unlevered free cash flow growth. Those are the companies I also often write about on this Substack. However, the hard part is actually purchasing them once they are identified, as this type of company tends to trade overvalued and is often recognized as the fortresses they are by the market.
I don’t mind being heavily concentrated, or at times having 100% of my portfolio allocation in a single stock if the opportunity is asymmetric enough. I tend to not actively manage my portfolio under normal circumstances, adhering to a boring “buy and hold” strategy. However, when situations arise where significant upside to fair intrinsic value presents itself, I don’t shy away from being more active and consolidating.
Performance since May 2024, the start of this portfolio
Total return: 261.83%, 114.71% CAGR annualized
S&P 500 (benchmark): 38.13%, 21.52% CAGR annualized
Performance against benchmark: +223.7%As of: December 28, 2025
The companies in this article are in no particular order.
This article is for informational purposes only and does not constitute investment advice or an offer to buy or sell securities.
Robinhood Markets, Inc. HOOD 0.00%↑
Company profile
Symbol: HOOD, Exchange: NASDAQ
Sector: Financial Services, Industry: Capital Markets
Theme: Growth
Fair intrinsic value: $171.74 (+45%), as of December 28, 2025
Market capitalization: $108 436 million
Pricing data: P/S 26x, P/E 49x
Most recent coverage:

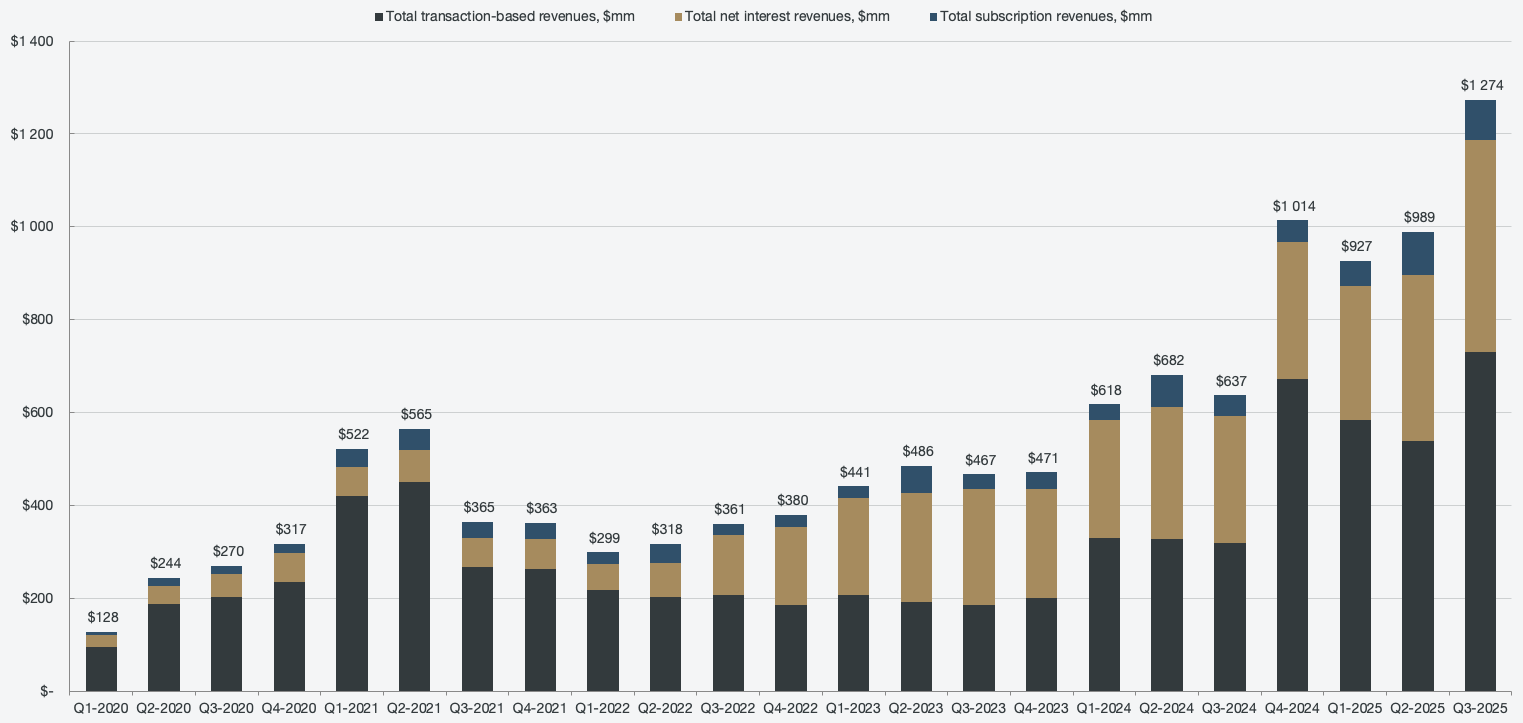
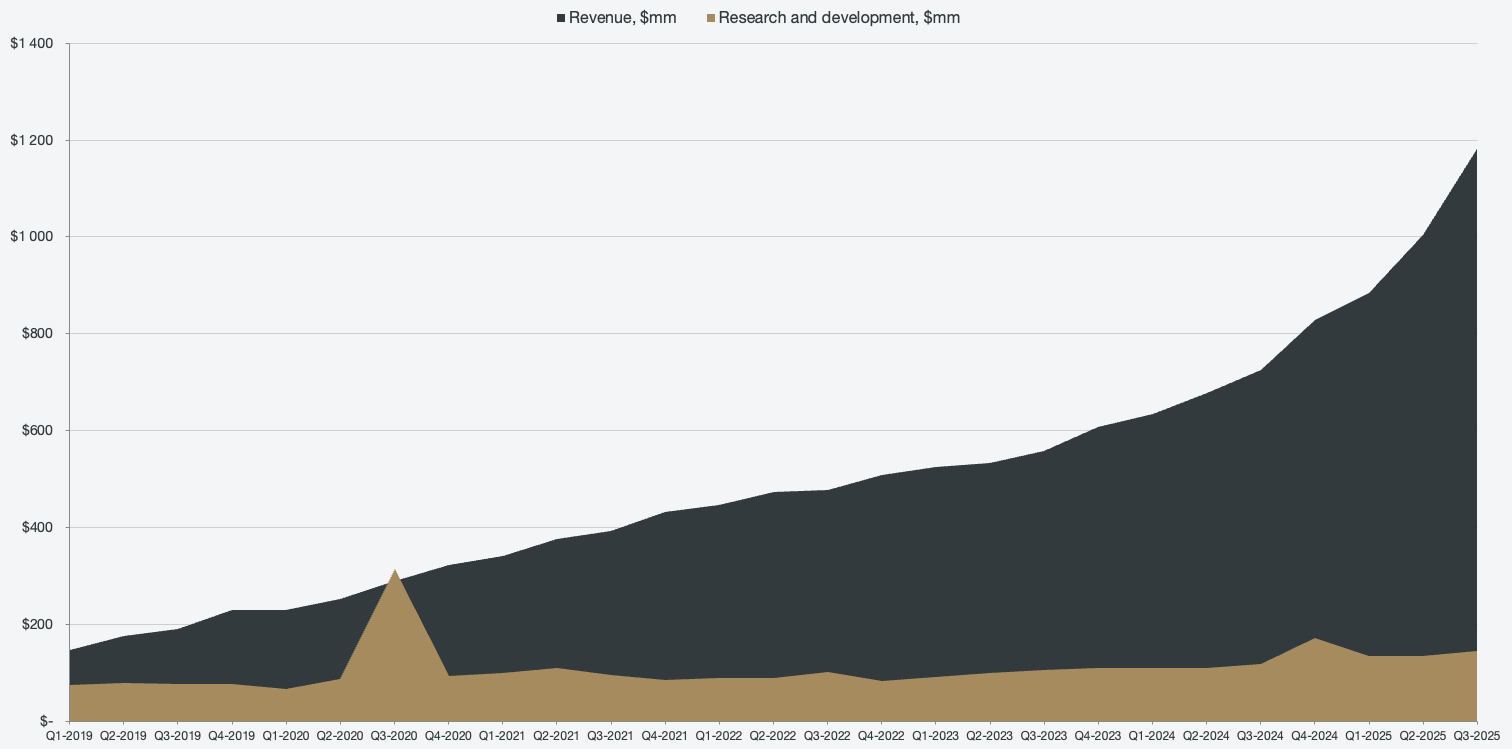
Robinhood is quickly emerging as a behemoth in the finance space. Out of all the companies I have researched, no company innovates and ships products at the pace of Robinhood. In 2019, Robinhood only had one line of business generating more than $100 million annually. As of 2025, that number is now 11, and the expansion shows no signs of stopping. Before long, I suspect we can start counting lines of business generating more than $1 billion for the company.
Figure 1: Segmented revenues
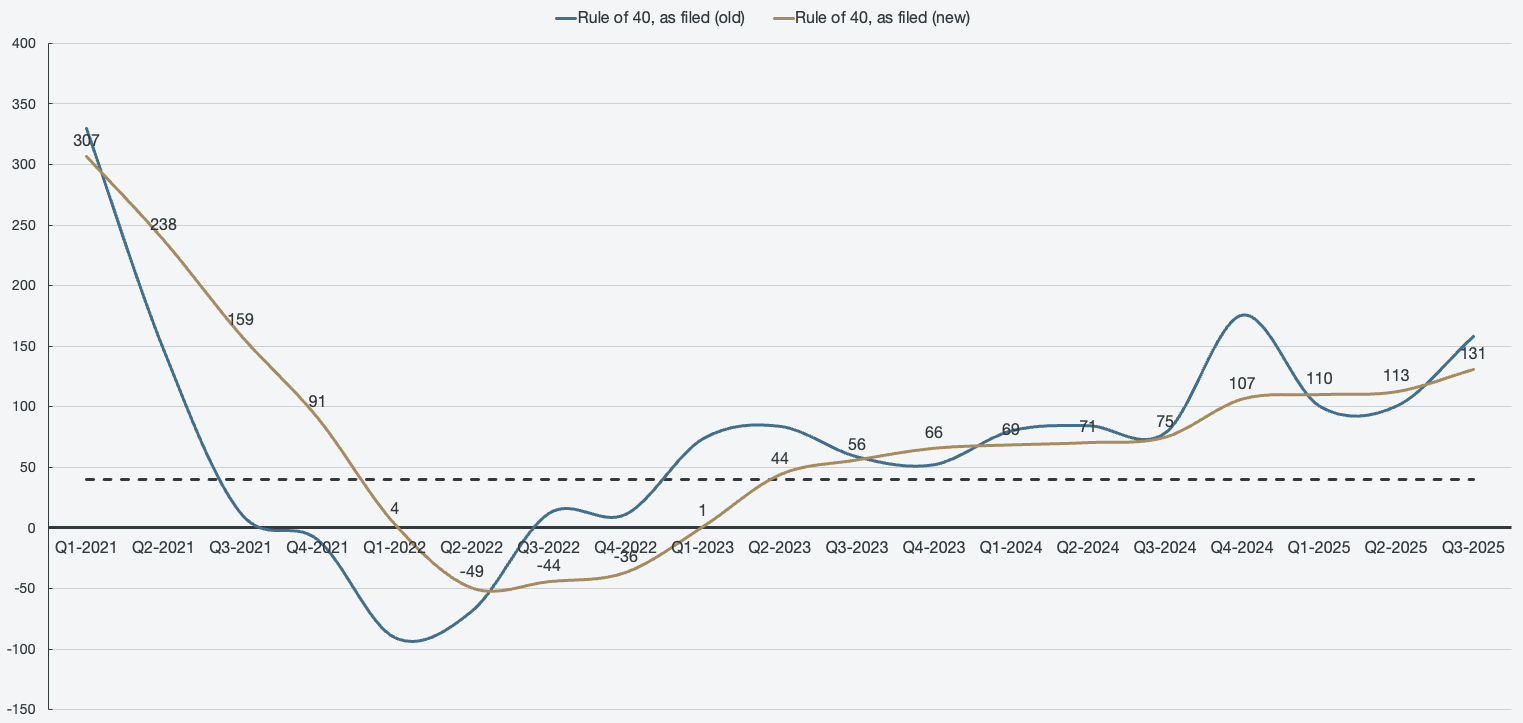
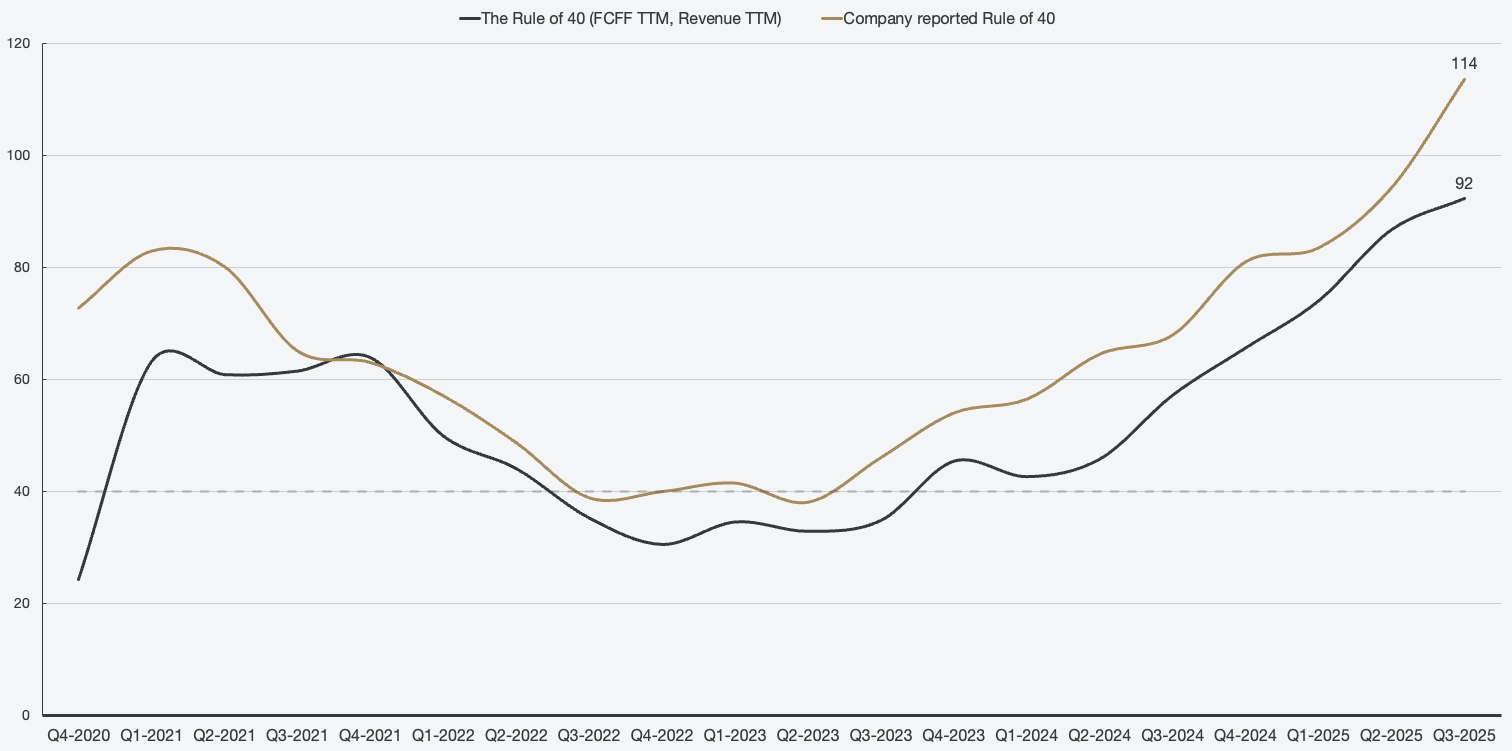
The hallmark of a high-quality business is being able to grow both revenue and margins at an accelerated pace, simultaneously. That specific dynamic becomes evident in several metrics, but perhaps most prominently in a rule of 40 score. The rule of 40 measures the quality of growth, where an ideal balance of growth and profitability for a SaaS company is at or above 40. Robinhood’s score as of Q3 2025 is 158 (131 TTM) using revenue growth and adjusted EBITDA (adjusted for SBC).
Figure 2: Rule of 40, period-over-period (old), trailing-twelve months (new)
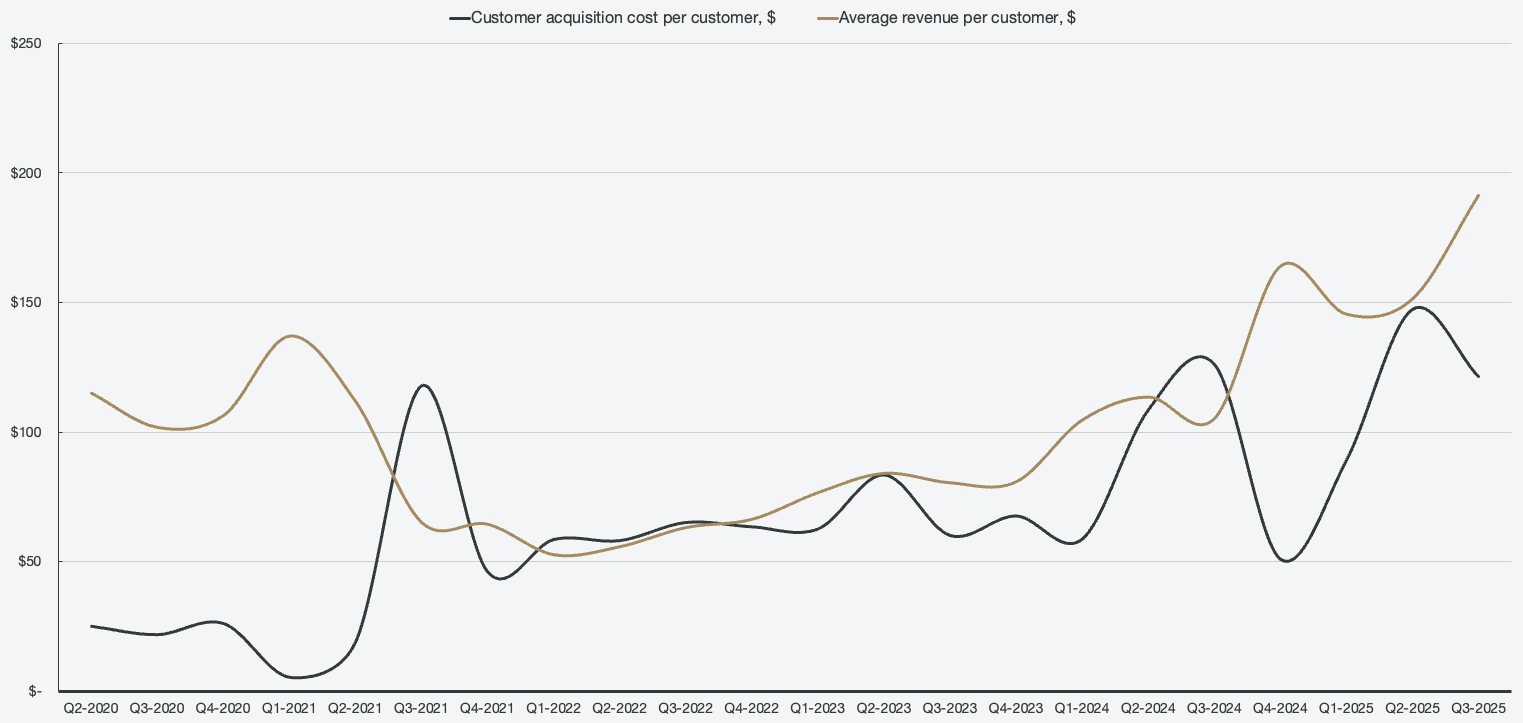
That absurdly high rule of 40 score is made possible with exceptional unit economics. Robinhood finds ways to generate more revenue per user over time, while the cost of acquiring the customers stagnates. Each acquired customer is increasingly more engaged with the various products and services and keeps increasingly more assets on the platform. Because of the superior product offerings, the customer is constantly re-engaging with the platform as Robinhood keeps innovating. This results in a beautiful flywheel effect.
Figure 3: Customer acquisition cost and average revenue per customer
I was aware of the company since the single digits but only entered with a meaningful position in the $30 range. The reason is that Robinhood had a lot of risks that I felt uncertainty around, such as regulatory concerns (PFOF), operating leverage concerns, and cyclicality risks. All of these concerns were dispelled over time, and as I looked deeper into the business, I was convinced that this one will be a winner.
Fair Isaac Corporation FICO 0.00%↑
Company profile
Symbol: FICO, Exchange: NYSE
Sector: Technology, Industry: Software - Application
Theme: High quality
Fair intrinsic value: $1 914.78 (+9%), as of December 28, 2025
Market capitalization: $43 043 million
Pricing data: P/S 22x, P/E 66x
Most recent coverage:

FICO is the original “mafia” company and embodies the term in every regard. The company has a ~99% share of the consumer credit score market, and the evidence can be found in the margins and the pricing power.
Figure 4: Scores operating margin
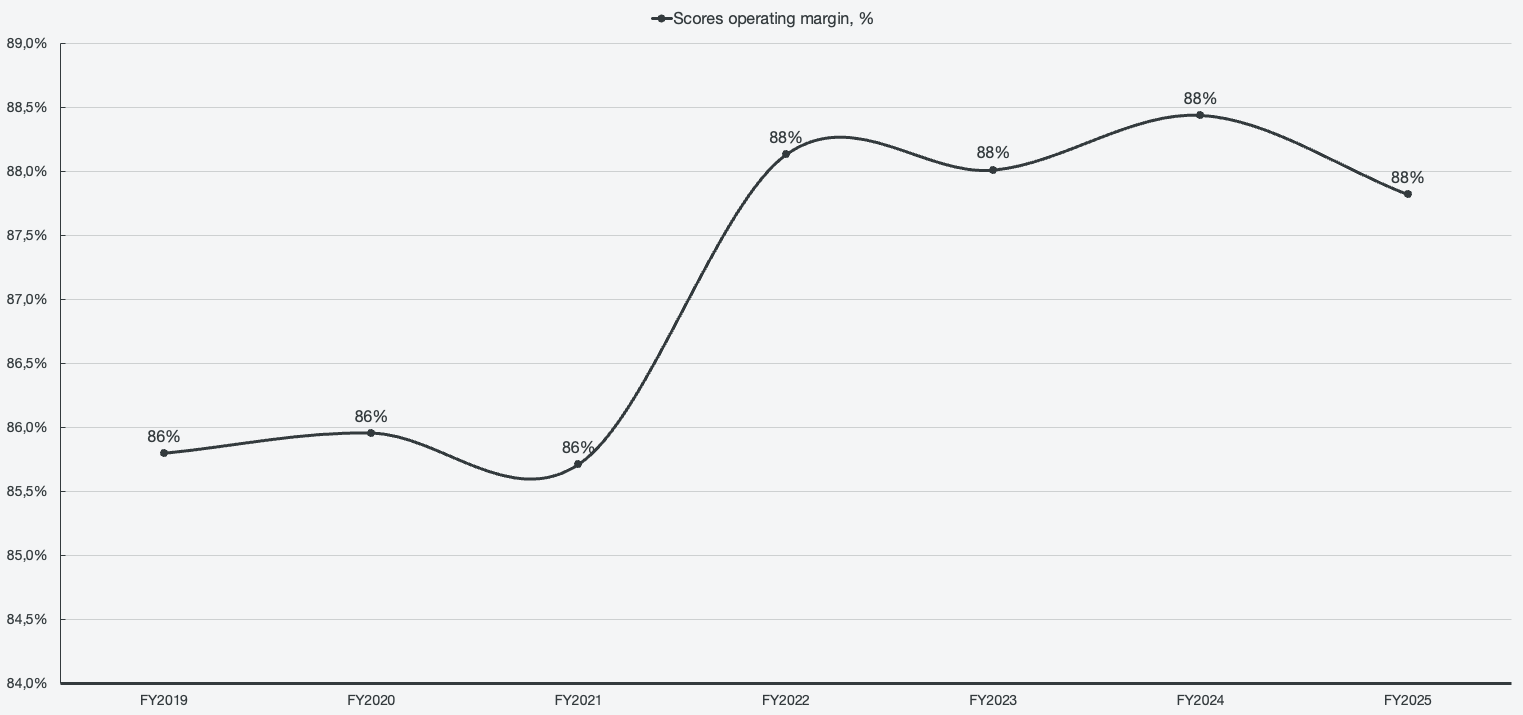
The sheer pricing power the company has is remarkable, as it is the de facto gold standard of consumer credit ratings. Competitors give away their model for free, and yet no one switches from FICO. The reason is that it is so deeply embedded across institutions that adopting a different scoring model would entail regulatory issues and re-rating across all portfolios. The base FICO score royalty per score was around ~0.60 for close to three decades, but that changed in 2018. Since 2018, the cost for pulling a FICO score is now $4.95 per score, which translates to $14.85 on a tri-merge basis. Since 2018, that is a ~725% price increase.
There is no reason FICO could not keep pushing their pricing power, as ~$5 per pull is relatively small compared to the overall cost of a mortgage. Closing fees are in the thousands, and the FICO score is a tiny fraction and unnoticeable for the consumer. While the moat is currently being leveraged for pricing power, FICO is also continuously refining the scoring model and making it more predictive, while also expanding coverage into additional markets and verticals.
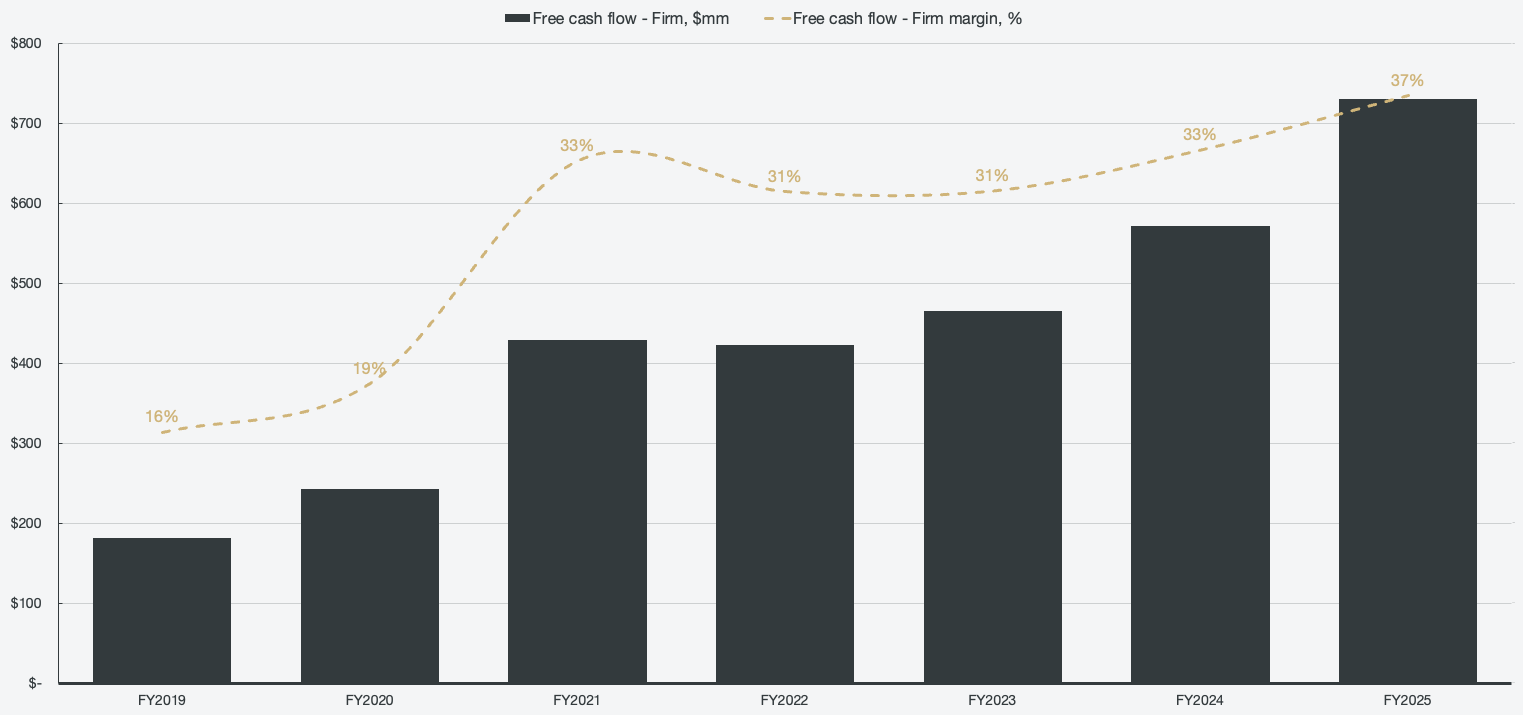
The compounding machine that is FICO is also generating tons of unlevered free cash flow, which in turn is used to repurchase shares. Over the past 5 years, FICO has repurchased ~25% of outstanding shares.
Figure 5: Free cash flow - firm
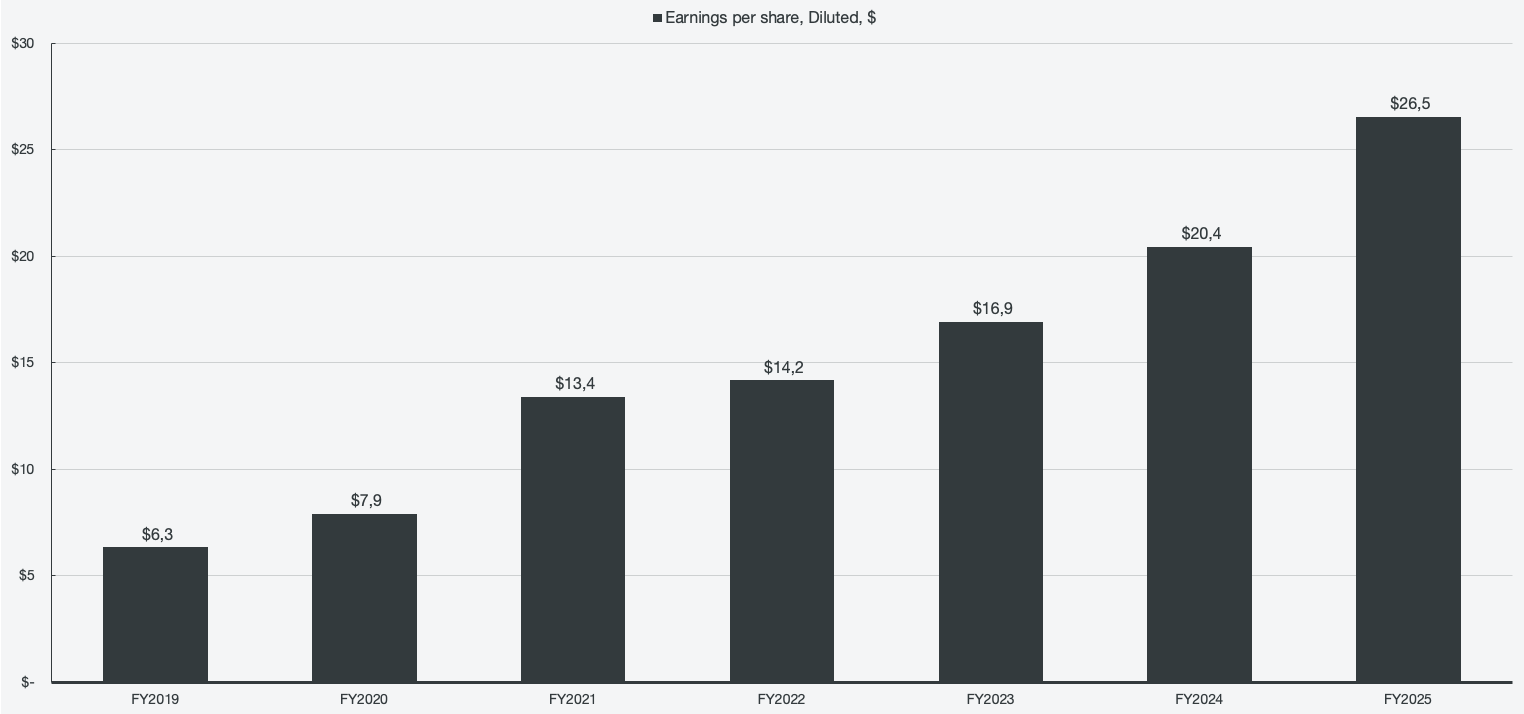
The company grew revenues 16% in 2025, and coupled with the phenomenal margin profile and the overall buybacks, the result in terms of earnings growth becomes quite impressive. EPS per diluted share has grown at a 27% CAGR since 2019.
Figure 6: Earnings per share
The only issue with FICO has been the stock quote. The market has recognized what an amazing company FICO is, and it has been trading quite elevated in recent years. However, patience has paid off, and I managed to add FICO at an attractive price point in 2025.
Palantir Technologies, Inc. PLTR 0.00%↑
Company profile
Symbol: PLTR, Exchange: NASDAQ
Sector: Technology, Industry: Software - Infrastructure
Theme: AI Software
Fair intrinsic value: $168.05 (-10.95%), as of December 28, 2025
Market capitalization: $485 184 million
Pricing data: P/S 125x, P/E 441x
Most recent coverage:

For two quarters in a row, Palantir has delivered what I consider to be the best results in SaaS history. This company continuously managed to outdo my expectations, and the sheer intrinsic value growth that occurs every quarter is without peer. The company itself has been, and continues to be, misunderstood by both professionals and peers. Palantir managed to identify how to extract value from AI years in advance and has no competition in the space. The company’s platform operates across every industry and sector imaginable, both in the commercial and government space.
Figure 7: Segmented revenue growth
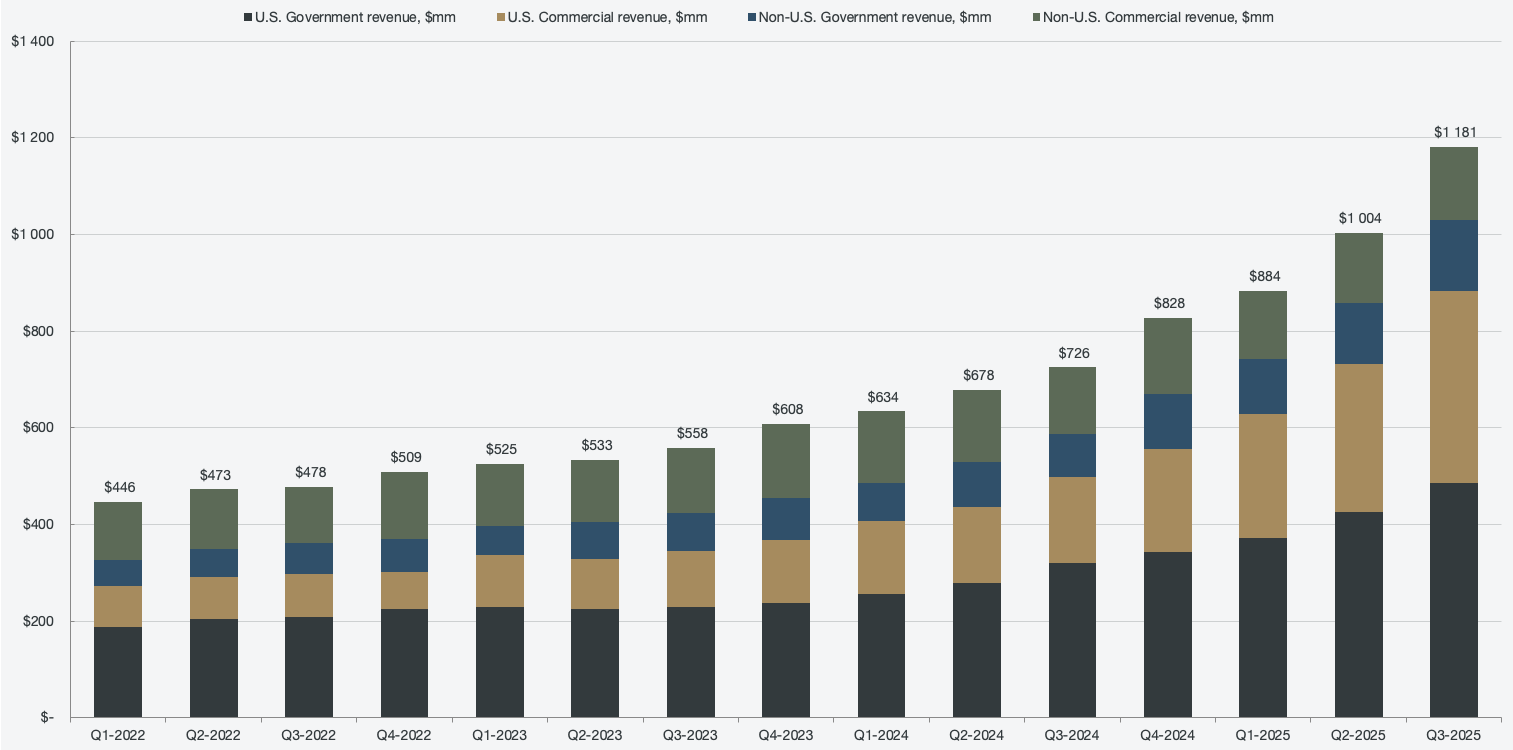
I think everyone is familiar with Palantir’s impressive growth by now: 133% Y/Y in U.S. commercial on an organic basis and 52% Y/Y within the U.S. government. However, while the growth is truly remarkable, the way they are growing is what truly impresses me. In Q3 of 2025, Palantir grew 63% Y/Y, but a majority of that came from customers that have been with Palantir for 12 months or longer.
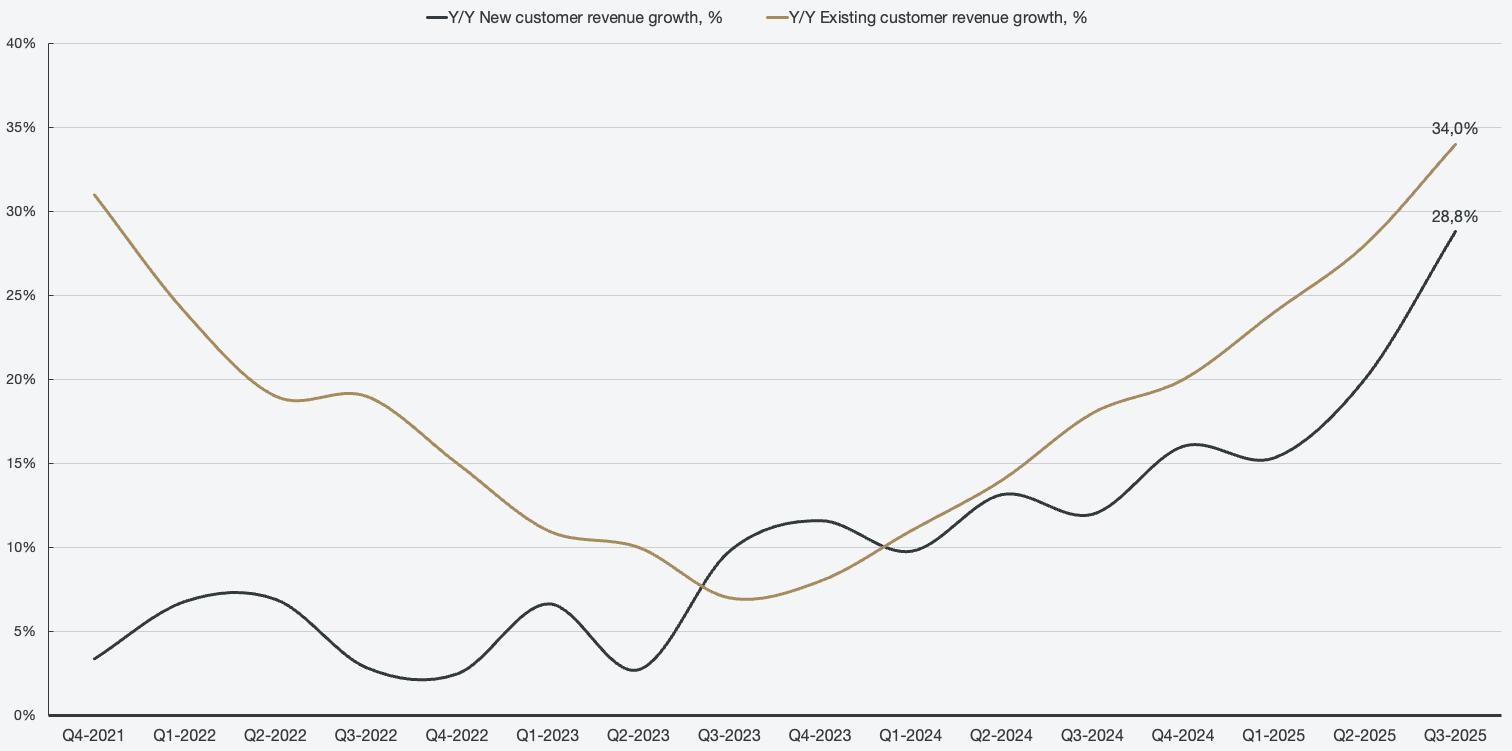
What sets up Palantir for long-term hypergrowth is the sheer scalability of its AIP platform. Since AIP’s pricing is usage-based, Palantir increasingly earns more from existing customers as they keep deploying AIP to solve more and more use cases or, in some instances, power the whole company’s operations. Looking at cohort growth, 34% of overall growth for the quarter came from customers already with Palantir for over a year, and the trend is increasingly upward.
Figure 8: Cohort growth
What is even more impressive is that on an annual basis, 43% of all revenue comes from only 20 out of 911 customers (2.2% of customers). Some may say that it is a major concentration risk, but I always saw it as a safety net in times when customer acquisition was more difficult. Then, why is it a safety net? Well, the top 20 customers are the cohort that has grown the most; 38% of 47% over a trailing-twelve-month basis came from the top 20 customers. This means that the largest and most powerful corporations that have deployed Palantir products are seeing such massive benefits from the software that they want to increase the spending at an increased pace. This solidifies Palantir’s solutions as incredibly sticky, and as such, it is a safety net rather than a concentration risk.
Another feat that is without a peer in the space is Palantir’s operating leverage. Palantir is managing to scale revenues at an incredible pace despite operating costs remaining relatively static. The margin expansion that is occurring has seemingly no end in sight, as Palantir’s employee force is the most efficient in the peer group by far.
Figure 9: Operating leverage
As mentioned with Robinhood, a true testament to a high-quality business is when the revenue can explode while simultaneously expanding margins aggressively. That is precisely what Palantir is doing, and the rule of 40 score is the testament to it.
Figure 10: The rule of 40
More or less all financial results point toward a continued acceleration across all segments, and I don’t see an end of it in the near term. Palantir’s pricing multiples may seem outrageous, but the business itself is outrageous. In addition, on an intrinsic value basis, the company is not exceedingly overvalued. Given the volatile markets we are currently experiencing, it is possible to acquire Palantir at an attractive price, which is what I have done.
DLocal Limited DLO 0.00%↑
Company profile
Symbol: DLO, Exchange: NASDAQ
Sector: Technology, Industry: Software - Infrastructure
Theme: Fintech Monopoly
Fair intrinsic value: $24.37 (72.69%), as of December 28, 2025
Market capitalization: $4 229 million
Pricing data: P/S 4.41, P/E 24.88x
Most recent coverage:
Planned for release soon.
I will keep it brief, as I have not yet published an equity research piece on DLocal. The reason I own it is because they truly have a differentiated business model in the payment processing space.
The company operates hundreds of alternative payment methods across a wide scope of geographies, focused on emerging markets. In many emerging markets, common payment methods from the modern world do not exist in the same capacity. A VISA or Mastercard debit card is not the standard; instead, there are payment methods specific to geographies. For example, consumers pay for their groceries with the SIM card inserted into their phone. This creates a market that no established payments processor wants to deal with, not only because it is so scattered and the markets are small, but also because there are significant regulatory hurdles. DLocal essentially has a monopoly on hundreds of these markets, and the growth the company is seeing is a result of the GDP growth in these emerging markets.
DLocal classifies as a mafia company, and that is why I have taken up a position in the company. There is a material moat to the business, the barriers to entry are incredibly high, and the company is growing fast at healthy unlevered cash flow margins. Even while accounting for significant risk, the company is significantly undervalued from an intrinsic value standpoint at the time of writing.
PayPal PYPL 0.00%↑
Company profile
Symbol: PYPL, Exchange: NASDAQ
Sector: Credit Services, Industry: Financials
Theme: Deep value
Fair intrinsic value: $118.95 (+98%), as of December 28, 2025
Market capitalization: $57 571 million
Pricing data: P/S 1.75x, P/E 11.71x
Most recent coverage:

PayPal, commonly nicknamed PainPal by investors, has stayed stagnant for 3 years in terms of the stock quote. However, this is a completely different company from back then. PayPal remains the behemoth in the online payments space, processing the most payment volume out of all peers. PayPal is seen as a legacy dinosaur by investors, and as a result, also trades as such.
However, I believe that PayPal has correctly identified the next evolution of finance and has positioned itself to pounce. It is one of the first major payment processors to secure deals with companies that operate LLMs, such as OpenAI, to enable agentic commerce. In addition, it has partnered with Google to integrate across Google’s suite of products, and a similar deal was also made with Mastercard to enable AI-agent-driven transactions.
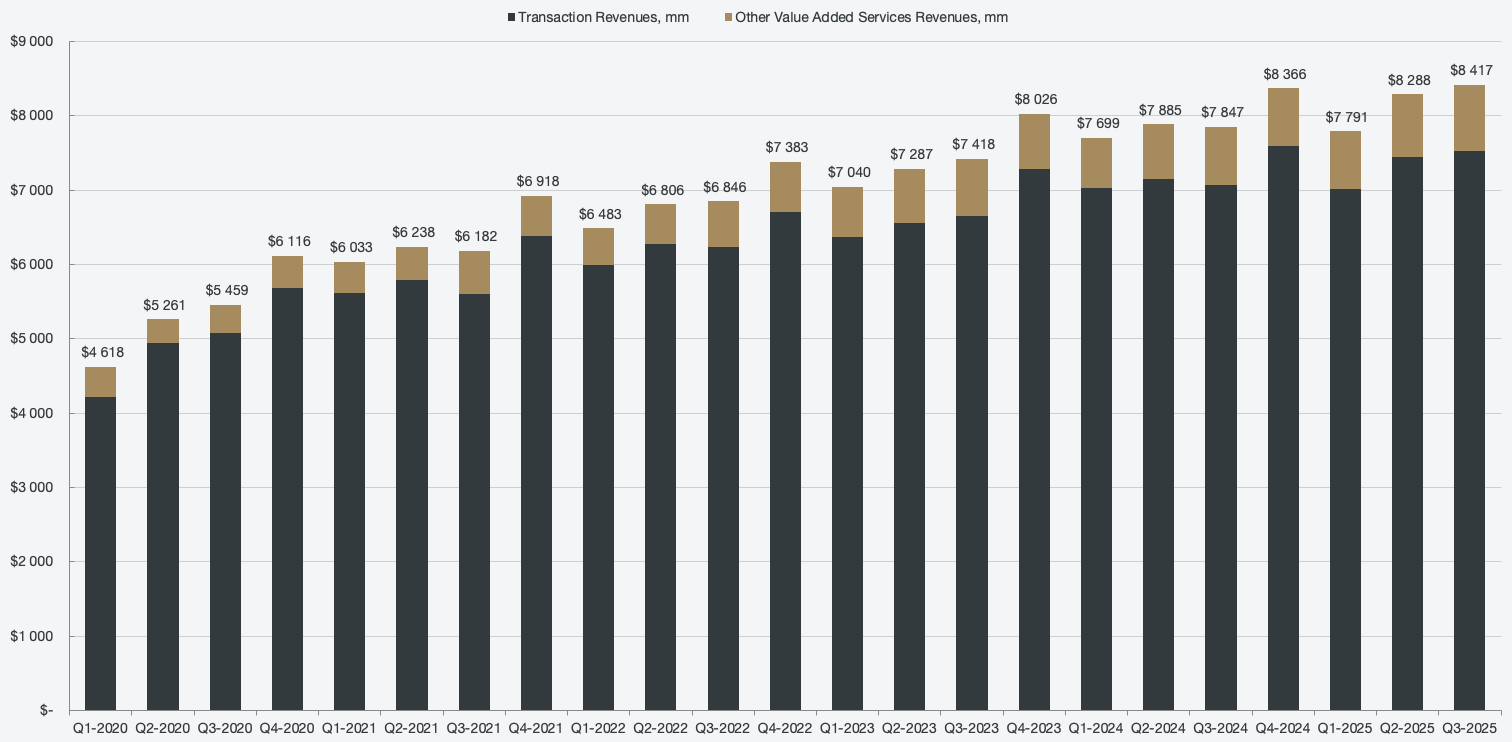
Becoming the premiere commerce orchestrator is an exciting prospect, but what I like about this stock is that it is not required for PayPal to become one in order to be intrinsically undervalued. The company is priced for roughly -4% CAGR over the next 10-year period. Not only is PayPal not expected to grow (while actually growing), but it is priced for a decline. PayPal is in fact growing, and management is doing so while increasing profitability.
Figure 11: Segmented revenues
Many consider PayPal to be dead money, and historically, the opportunity cost associated with the stock has been significant. However, it’s always easy to operate in hindsight. The largest returns are made when you own a stock before it shoots up and gets recognized. For example, Palantir stock was quite dead and relatively in the gutter until the launch of AIP, which resolved all of the challenges the company was facing. I am not comparing PayPal to Palantir, but PayPal is not such a bad company as the stock price would make you believe. In addition, there is a dynamic at play that leaves me confident the downside is very limited.
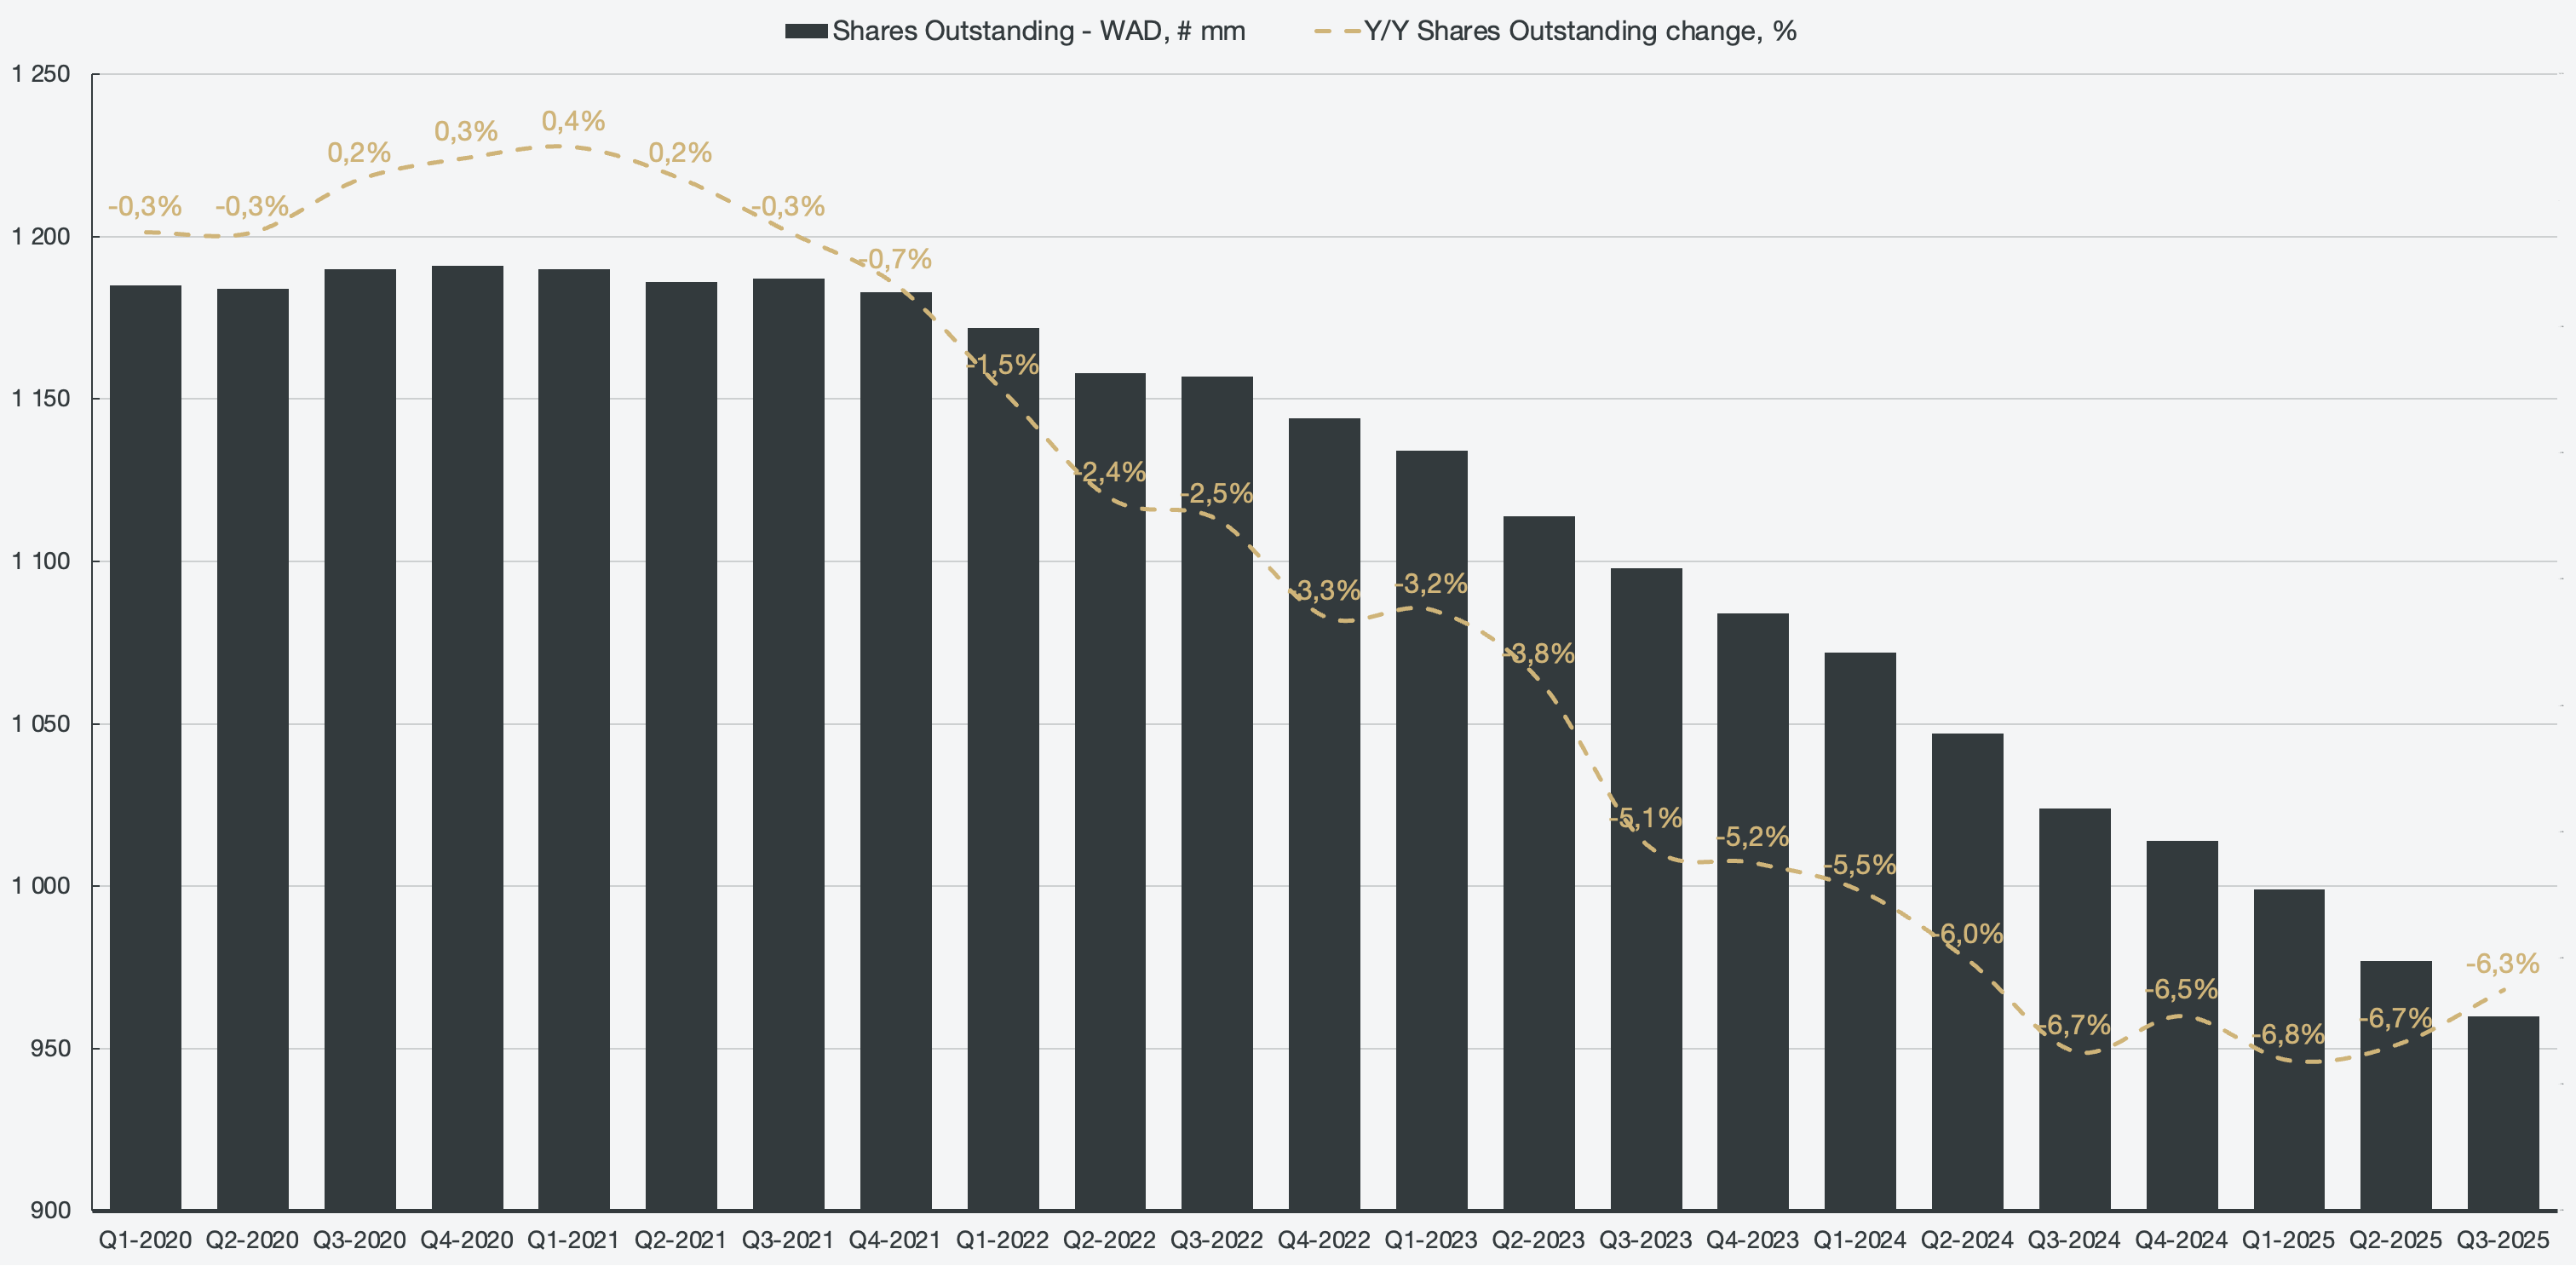
PayPal is generating significant amounts of cash, and they are using that cash towards share repurchases. Most of the free cash flow that is generated is pledged towards share repurchases, and over the past 5 years, PayPal has repurchased about 20% of their outstanding shares. At this rate, the company will be taken private in a few years, something that would be accelerated even further if the stock price were to drop even further.
Figure 12: Weighted-average diluted shares outstanding
Summarized, the company is quite healthy; it is growing, generating substantial amounts of cash, and positioning itself to be a major player in the next evolution of finance. The stock price is reflecting a narrative of a deteriorating business, which I simply believe is not the case.
For more in-depth coverage, please see the related equity research articles for each company.